


Silver Fractal Analysis Suggests May-June Target of $52-$56
Commodities / Gold and Silver 2011 Feb 22, 2011 - 05:25 AM GMTBy: GoldRunner

 Dollar Inflation remains the driver of the pricing environment for almost everything denominated in U.S. Dollars as long as the Fed continues to monetize debt. The debt monetization creates Dollar Inflation that results in Dollar Devaluation. As the Fed ramps up the QE II that they have announced will end in June, I expect Gold, Silver, and the PM stocks to aggressively rise.
In previous articles I have shown that fractal analysis suggests that:
- Gold could reach $1860 into the May/ June period based on the late 70’s Fractal. I have also shown the potential for Gold to rise even higher if the market psychology is volatile enough - up to $1975, or even up to $ 2250.
- The HUI at from HUI 940 to 970 by mid-June is a distinct possibility and we will discuss the fractal considerations for the PM stock indices further in the next editorial.
- Silver could reach $52 - $56 into May – June of 2011 as explained in this article.
Fractal analysis provides us with:
- decent target estimates in price and in time,
- decent reference points to keep us on track and, most importantly,
- decent expectations for the quality of potential price moves.
Let's look at the potential for the next intermediate-term move in Silver in relation to the 2006 fractal period and then in relation to the 1979 fractal period using ratio analysis.
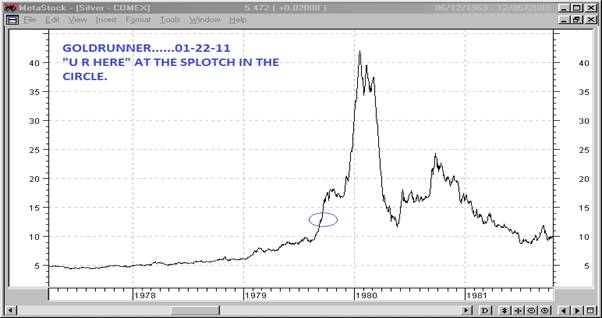
The Silver Chart From 1977 – 1978
The chart below is a “line chart” of the 1979 portion of the long-term Silver bull and because it does not show the spikes in price inherent in a Silver bull the true upward run in price would be higher than what is actually shown.
The circled area on the Silver chart is analogous, in fractal terms, to where we are today. The chart shows that the run out of the analogy to today’s correction was a bigger run than the price move up into it. The estimated time to the next intermediate top measures to May/ June of 2011 which matches the stated current program of QE II in effect by the Fed.
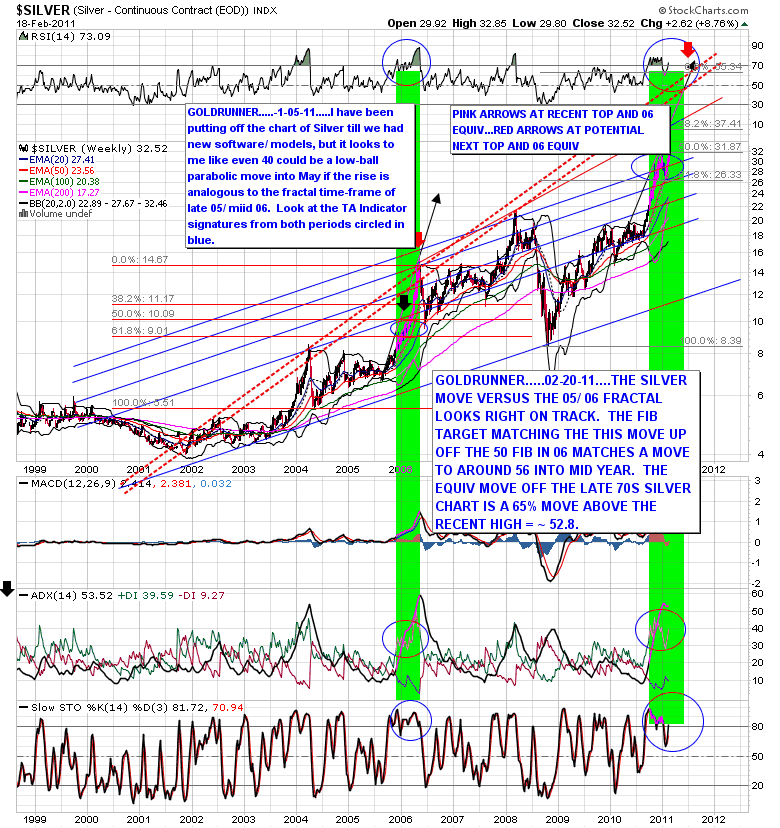
Today’s Silver Price vs. the 2006 Fractal Move Suggests the Next Top at 52.8
- The black lines in the chart below show the approximate slope for the current intermediate-term move as related to the similar fractal move in 2006.
- The red dotted lines off of the previous tops show a general range of where the next intermediate-term top might lie based on the symmetry of previous old top history series.
- The fib indicator is placed the same in both fractal periods - off of the last intermediate low with the 50% line off the top of the “recent high” (at black arrow) and the .618 fib off of the low that followed. This fib placement fit the next intermediate-term top (at red arrow) in the 2006 Silver Fractal. Today, an equivalent fractal top for Silver would come in around 56 into the May/ June 2011 time period at the RED ARROW. In the 2006 Silver Fractal, the next intermediate-term top came on a rise 65% above the last recent top. A similar target for May/ June would be to 52.8. This difference between fractal periods appears to be logical since we have reached a more aggressive portion of the parabolic rise on the chart, today, versus 2006.
Red arrows and black arrows have been placed at analogous points on the chart. We can see similar formations that have formed on the Technical Indicators in the RSI, ADX, and Slow Stochastics.
In summary, the black line in the current period reaches the red angles lines in an area where the lower red dotted line will be around $48 to $49 into the late May/ June period and the upper red dotted line will be in the $55 to $57 area in that same approximate period. Considering all of the above, I will be looking for a potential top in Silver into May/ June 2011 to around $52 with the potential to see a spike up to as high as $56.
Another Silver 2006 Fractal Chart
The chart below should clarify the work I did annotating the chart above.
To estimate the timing and the eventual price level of the next intermediate top in silver off the 2006 fractal, I have noted in both the current and 2006 periods:
- The last high before break-out for the last aggressive run
- The last bottom before that run as POINT A
- Cluster top equivalent of the recent high as POINT B
- The recent hammer bottom and 2006 equiv off the cluster tops
- The double top 2006 equivalent of our next expected intermediate-term top.
I have done a rough count in terms of "time" from Point A to Point B. The current ratio in terms of time for "A to B" versus the 2006 period is around 1.8. Using the ratio times the 2006 time periods yields a range of ~ 18 to 23 weeks to each of the double tops of 2006. That estimate in time would put us into late May to early June.
In terms of price, my confidence in the use of the 2006 fractal comes from how closely the 05/ 06 fractal worked off of the "recent prime 2002 fractal." The move from point B to Point C in 2006 was almost precisely 2 times the rise from Point A to Point B. Thus, we would expect the coming run up into the next intermediate term high to be about 2 times the rise from the last bottom before break-out up to the recent high. The current period "A to B" is approximately ~ 14. So, 2 times 14 = 28 added to 31 gives us a potential rise, spikes included, up to about $59 for the coming intermediate term top. This is only a comparison off of 2006.
I would be quite happy to see a rise up to $48 to $52 yet the move in Silver in the 1979 parabolic move suggests a spike to a point a bit higher as the psychology of a parabolic move would suggest.

Gold Denominated in South African Rand
If Gold priced in Rand rises out of the ascending triangle to the upside as shown in the chart below, then
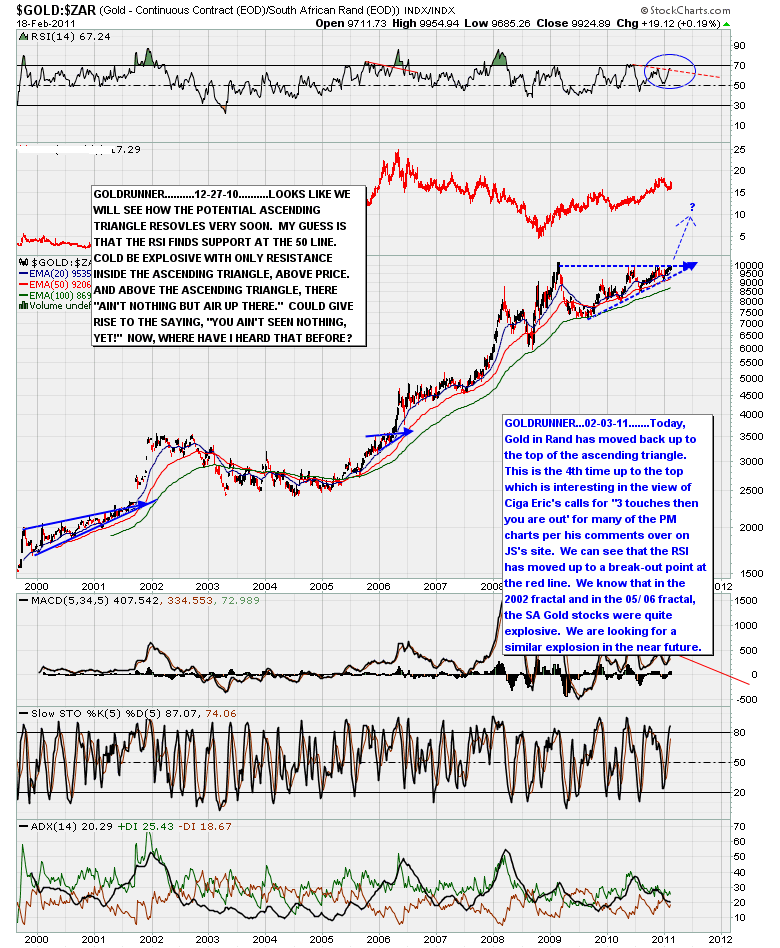
SA gold stocks could start to rise in a momentum run analogous to their runs in early 2002 and in 2005/ 2006. The RSI has already broken out while price sits at the top of the huge ascending triangle. It is "3 touches and out for the PM sector” (as per Ciga Eric), and if so, this is the 4th attempt at the top of the triangle. In the 2006 fractal period I showed with Silver, above, Gold in Rand rose sharply higher out of a triangle formation sending the SA Gold Stocks into an upward momentum run which, historically, have very large 3rd wave runs that tend to move in sync with the HUI Index.
Conclusion
The PM sector upside looks like it could be explosive in the coming months just as in the 1979 fractal. I think is time to get positioned to take full advantage of the coming move.
GOLDRUNNER
Goldrunner has also posted this article on the public side of www.GoldrunnerFractalAnalysis.com which will soon be a subscription website. (Please note that the subscription button on the site is not active at this time.) to be informed as to when the subscription service is available please contact GOLDRUNNER44@AOL.COM.
Lorimer Wilson is the Editor-in-Chief of www.FinancialArticleSummariesToday.com and www.munKNEE.com and will soon be offering a FREE weekly “Top 100 Stock Market, Asset Ratio & Economic Indicators in Review”. To sign up contact him at editor@munKNEE.com .
Disclaimer: Please understand that the above is just the opinion of a small fish in a large sea. None of the above is intended as investment advice, but merely an opinion of the potential of what might be. Simply put:
The above is a matter of opinion and is not intended as investment advice. Information and analysis above are derived from sources and utilizing methods believed reliable, but we cannot accept responsibility for any trading losses you may incur as a result of this analysis. Comments within the text should not be construed as specific recommendations to buy or sell securities. Individuals should consult with their broker and personal financial advisors before engaging in any trading activities. Do your own due diligence regarding personal investment decisions.
© 2005-2022 http://www.MarketOracle.co.uk - The Market Oracle is a FREE Daily Financial Markets Analysis & Forecasting online publication.