


What's Wrong with Government Debt
Interest-Rates / US Debt Mar 07, 2011 - 03:56 PM GMTBy: Robert_Murphy

The news abounds with arguments and even riots over so-called austerity measures. Whether in the Middle East, Europe, or even certain US states, the public is realizing just how deep a hole various governments have dug for themselves. In this article I'll outline Uncle Sam's position and then explain why it's such a problem.
A Shocking Chart
I considered myself fairly conversant with the fiscal trends for the federal government, but I was shocked to see Keith Hennessey's illuminating chart of the trends projected in the Obama administration's February budget report:
President Obama's Proposed Budget Path
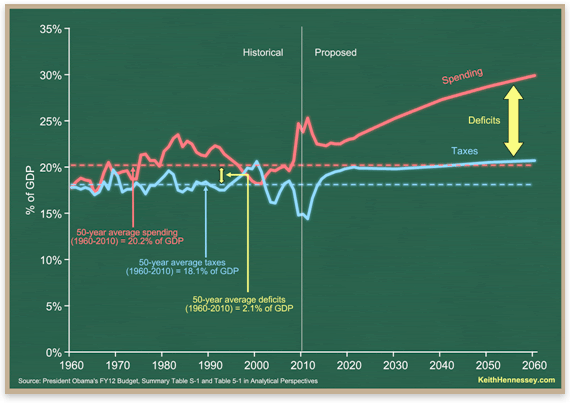
At first the reader may think the chart is disturbing but no cause for panic; after all, the economy grows over time, so we'd expect spending and deficits to get gradually bigger over the coming decades. Such a reaction would be acceptable if the y-axis of the chart were denominated in dollars. But unfortunately, the y-axis is percentage of GDP.
According to Hennessey, the White House projections assume that the economy gradually moves out of recession, and tax revenues recover, shrinking the annual federal-budget deficit to a low point of 2.9 percent of GDP by 2018. But after that point, the deficits get progressively bigger, not merely in absolute dollar terms but even as fractions of the economy.
The Relation between Deficits and Debt
If we ignore liabilities such as Social Security and Medicare and focus instead just on the actual bonds issued by the Treasury when it borrows money, then each year the outstanding federal debt increases by that year's budget deficit. For example, if the government starts the year off owing $10 trillion to bondholders, and then runs a $300 billion deficit, it ends the year owing $10.3 trillion. In order to keep the federal debt constant in absolute dollar terms, the government would (obviously) need to balance its books, and only spend each year (including interest payments on the existing debt) what it takes in as taxes and other revenues.
If we move from absolute dollar terms into percentages of GDP, things get a little trickier. Because the economy grows over time, it's possible for the government to run perpetual deficits while maintaining a constant debt/GDP ratio.
For example, using inaccurate but nice round numbers, suppose the debt is $10 trillion and GDP is $20 trillion. That means the debt-to-GDP ratio is 50 percent. Suppose further that the economy will grow on average 5 percent (in nominal terms) each year. In that case, the government can perpetually run a deficit equal to 2.5 percent of the entire economy, and keep the overall debt-to-GDP ratio constant at 50 percent.
Let's check the math for the first two years to see the pattern: In the first year the government runs a deficit of $500 billion (which is 2.5 percent of $20 trillion). At the end of the first year, then, the debt has grown to $10.5 trillion, while the economy has grown by 5 percent to $21 trillion. Thus the debt-to-GDP ratio is 50 percent ($10.5 trillion / $21 trillion = 0.5) just as before.
In the second year, the government runs a higher deficit of $525 billion (which is 2.5 percent of $21 trillion). At the end of the second year, then, the debt has grown to $11.025 trillion ($10.5 trillion + $525 billion = $11.025 trillion). Meanwhile the economy has grown another 5 percent to $22.05 trillion, keeping the debt-to-GDP ratio constant at 50 percent ($11.025 trillion / $22.05 trillion = 0.5).
The general pattern is that to maintain a constant debt as a fraction of the economy, the deficit as a share of the economy has to be the debt fraction multiplied by the growth rate of the economy. (With our numbers, 50 percent debt multiplied by a 5 percent growth rate meant a 2.5 percent deficit was needed to maintain a constant debt load.)
Interest rates don't directly affect this calculation, but they do make it harder to keep the deficit limited to a particular share of the economy. Let's return with our example and go back to the first year: With an initial debt of $10 trillion, average interest rates of 3 percent on Treasury securities means that $300 billion of the government's budget will go to paying bondholders. If interest rates rise to 7 percent, then the government will have to allocate $700 billion for this purpose. Either way, to maintain the debt burden, the government can only run a $500 billion deficit. But the point is that there will be $400 billion more in goodies available to the public — including the possibility of tax relief — if the debt is rolling over at 3 percent versus 7 percent.
As Hennessey's chart shows, the deficit as a share of (real or inflation-adjusted) GDP is projected to steadily grow after 2018. Even if the red line leveled off at the far right edge of the chart, so that the deficit stabilized at 10 percent of GDP after the year 2060, a typical 3 percent growth rate in real GDP would mean that the debt-to-GDP ratio would ultimately stabilize at a whopping 333 percent of GDP.
International investors might tolerate such an incredible debt ratio for temporary emergencies such as a war, but if built-in demographic shifts lead the United States to head down such a path, bond default (either explicit by the Treasury or implicit by the Fed's monetization) will appear inevitable. Hennessey's chart isn't scary because it will actually happen; people will have to alter course sooner than that.
On the contrary, Hennessey's chart is scary because it shows, in his words, that the "long term budget problem begins now."
Do Deficits Matter?
Ironically, there are some commentators who argue that federal-budget deficits are either meaningless (because the government issues US dollars) or even beneficial, because they are the only mechanism through which private Americans can save on net. I have dealt with these specific arguments elsewhere, but let me reiterate why huge and perpetually growing deficits are a problem.
Contrary to Keynesians, the problem with government budget deficits is not merely that they (typically) lead to higher interest rates and thus reduce private-sector investment and consumption spending. Because, in this context, the Keynesians only look at economic factors insofar as they work through "aggregate demand," they understandably think that large deficits can't possibly hurt anything when interest rates are practically zero.
However, Austrian economists have a much richer model of the capital structure of the economy. In this view, economic health isn't simply a matter of propping up total spending high enough to keep everybody employed. On the contrary, resources need to be deployed in particular combinations in particular sectors of the economy, so that semifinished goods can be transformed step-by-step as they move through the hands of various workers at different businesses and finally onto retail shelves.
When the government buys (say) $1 trillion more than it takes in as tax revenues, it diverts real resources out of the jurisdiction of private entrepreneurs and into politically directed channels. Ultimately, it is not deficits per se but total government spending that distorts the economy and starves the private sector of resources. But deficits are insidious because they give the illusion of freebies in the near term, and the reckoning comes with a vengeance down the road.
Conclusion
American politicians are always talking about "reining in entitlements" and "getting serious about the deficit." As Keith Hennessey's sobering chart reveals, that time is now. If citizens do not demand a serious retrenchment in government spending, foreign creditors will eventually make the tough choices for us, and on much harsher terms.
Robert Murphy, an adjunct scholar of the Mises Institute and a faculty member of the Mises University, runs the blog Free Advice and is the author of The Politically Incorrect Guide to Capitalism, the Study Guide to Man, Economy, and State with Power and Market, the Human Action Study Guide, and The Politically Incorrect Guide to the Great Depression and the New Deal. Send him mail. See Robert P. Murphy's article archives. Comment on the blog. ![]()
© 2011 Copyright Ludwig von Mises - All Rights Reserved Disclaimer: The above is a matter of opinion provided for general information purposes only and is not intended as investment advice. Information and analysis above are derived from sources and utilising methods believed to be reliable, but we cannot accept responsibility for any losses you may incur as a result of this analysis. Individuals should consult with their personal financial advisors.
© 2005-2022 http://www.MarketOracle.co.uk - The Market Oracle is a FREE Daily Financial Markets Analysis & Forecasting online publication.