


Stock Market Correction Confirmed
Stock-Markets / Stock Markets 2011 Mar 12, 2011 - 09:11 AM GMTBy: Tony_Caldaro

 The week started with the market remaining in its SPX 1303 to 1332 trading range. During the latter part of the week the lower end of the trading range broke down, confirming an OEW downtrend, and the market traded down to SPX 1292 on friday before recovering during the day. Economic reports remained mostly good with positives beating out negatives 7 : 4. On the positive side, consumer credit continued to expand while wholesale/business inventories, retail sales, excess reserves, the monetary base and the WLEI all improved. On the negative side, the trade/budget deficits expanded, weekly jobless claims increased and consumer sentiment declined.
For the week the SPX/DOW were -1.15%, and the NDX/NAZ were -2.55%. Asian markets lost 2.3%, European markets dropped 2.3%, the Commodity equity group declined 3.4%, and the DJ World index was -2.5%. US Bonds were +0.8%, Crude lost 3.1%, Gold slipped 0.8%, and the USD gained 0.4%. Next week’s reports will be highlighted by housing, PPI/CPI, industrial production, the FOMC meeting and Options expiration. Busy week!
LONG TERM: bull market
After the longest uptrend of the entire bull market, in points and time, the point of recognition has finally been achieved. Remember, this bull market began in March 2009 at SPX 667. The recent February 2011 high of SPX 1344 is slightly more than double the starting point. And only now is the bull market is being recognized as a bonafide bull market. Certainly there are some still calling this entire long term uptrend a bear market rally. They, however, also called the 2002-2007 bull market a bear market rally. Until it started making all time new highs.
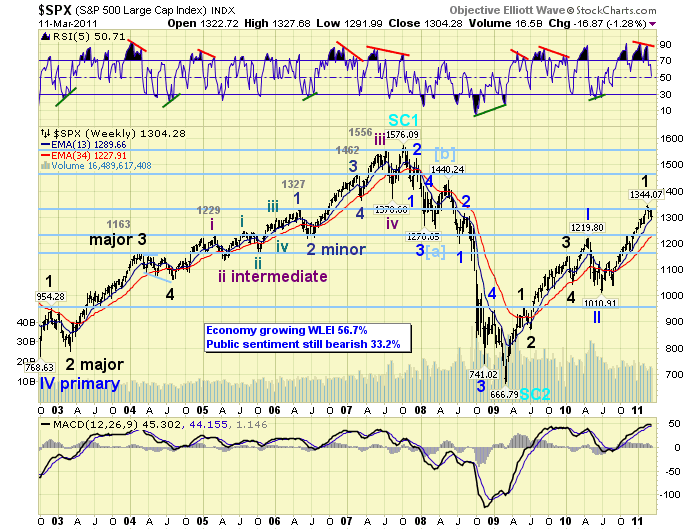
The weekly chart above displays the overall wave count for this bull market. From the Mar09 low at SPX 667 the market rallied in five Major waves to complete Primary wave I in Apr10 at SPX 1220. Then the market corrected about 17% to complete Primary wave II at SPX 1011 in July10. After that Primary wave III began. The first wave (uptrend), Major wave 1, completed in Feb11 at SPX 1344. Major wave 2, a downtrend, is now underway. Once this downtrend completes Major waves 3, 4, and 5 will need to unfold to complete Primary wave III. Then we will experience another steep correction to set up the final Primary wave (five) to end the bull market. We’re still expecting the bull market to end in 2012 near or above the 2007 high. Lots of bullish activity yet to unfold in the months ahead.
MEDIUM TERM: downtrend
After much speculation with alternate counts the main SPX count, labeling the Feb10 SPX 1344 high as Major wave 1, proved to be correct. The correction, Major wave 2, has officially just completed its third week. Yet, after the initial decline to SPX 1294 the market went range bound for a couple of weeks, and only made a lower low on friday at SPX 1292. Thus far this has not been much of a correction, only 3.9%. The two previous Major wave corrections were both 9.1%.
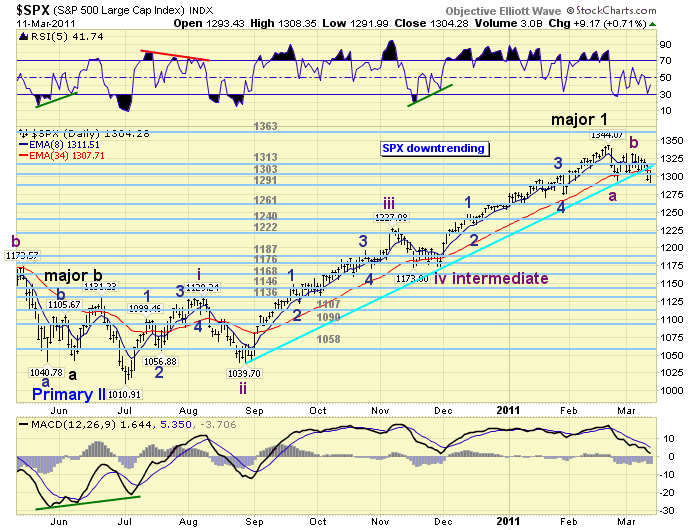
After we recieved an OEW downtrend confirmation we were able to post a short term count for this correction. Since this is a Major wave correction it should unfold in three Intermediate waves: ABC. The first Int. wave, wave A, we labeled at SPX 1294. Then the double top rally to SPX 1332 we labeled Int. wave B. The decline from SPX 1332 should be Int. wave C. Fibonacci relationships suggest three potential downtrend targets: SPX 1282 (wave c = wave a), SPX 1252 (c = 1.6 a), and SPX 1202 (c = 2.6 a). There are four OEW support pivots within that range: 1291, 1261, 1240 and 1222. When we combine fibonacci, the pivots and the typical percentage drop for this type of wave, in this bull market, we arrive at a downtrend target near the OEW 1222 pivot. Naturally, we will be monitoring this decline as it unfolds and keep everyone updated.
SHORT TERM
Support for the SPX is at 1303 and then 1291, with resistance at 1313 and then 1363. There is also some short term resistance at SPX 1308 and 1332. Short term momentum displayed a very slight positive divergence at the friday low and ended the week approaching overbought. With 12 of the 15 world markets we track in confirmed downtrends, it is surprising that only 4 of the 9 SPX sectors are in confirmed downtrends. Either the US market is holding up remarkably well, or, the next selling wave will drive those uptrending sectors lower. The uptrending sectors are: XLE, XLP, XLV, XLY and XLU.
We have labeled the first decline in late February, from SPX 1344 – 1294, as Int. wave A. The double top rally at SPX 1332 in early March as Int. wave B. Intermediate wave C has been underway since then. Since Int. A appeared to be five waves down, we’re expecting Int. C to also be five waves down to complete a zigzag. Currently it appears Minor wave 1 declined to SPX 1304 and Minor wave 2 rallied to SPX 1326. The decline from tuesday’s high at SPX 1326 is part of Minor wave 3. Overhead resistance is at SPX 1308, which is within the 1313 pivot range. We would not expect the market to break out of that pivot range. Should the SPX rally above 1332 we may have already seen the low for this downtrend. Best to your trading!
FOREIGN MARKETS
Asian markets were all lower on the week for a net loss of 2.3%. Only China’s SSEC remains in an uptrend.
European markets were all lower on the week as well for the same loss 2.3%. All five of these indices are in confirmed downtrends.
The Commodity equity group were all lower on the week for a net loss of 3.4%. Canada’s TSX is downtrending, while Russia’s RTSI and Brazil’s BVSP remain in uptrends.
The DJ World index is also downtrending with a net loss of 2.5% on the week.
COMMODITIES
Bonds, which have been uptrending since the Feb low near 118, gained 0.8% on the week. 10YR yields have declined from 3.74% to just under 3.40%.
Crude has been uptrending since late January, but lost 3.1% on the week. It appears to be in wave 4 after hitting a fibonacci $107 in wave 3. We may see an uptrend top around the fibonacci $111 level.
Gold has also been uptrending since late January. It lost 0.8% on the week after hitting an all time high of $1444 on monday. The current Minute wave ii pullback, if not over, should find support around $1400.
The USD has been downtrending since early January but it gained 0.4% on the week. The currencies have not had much of an impact in recent weeks despite the strong rally in Crude, Commodities, and Gold. All fiat currencies appear to be depreciating in value at about the same rate.
NEXT WEEK
A busy week ahead. On tuesday we have the FOMC meeting, the NY FED, Import/Export prices, and the NAHB housing index. On wednesday, Housing starts, Building permits, the PPI and the Current account deficit. Then on thursday, weekly Jobless claims, the CPI, Industrial production, Leading indicators and the Philly FED. Friday is Options expiration. Nothing scheduled for the FED except tueday’s meeting. Best to your week! And, thank you for your patience while OEW made the relocation transition halfway across the country.
CHARTS: http://stockcharts.com/def/servlet/Favorites.CServlet?obj=ID1606987
http://caldaroew.spaces.live.com
After about 40 years of investing in the markets one learns that the markets are constantly changing, not only in price, but in what drives the markets. In the 1960s, the Nifty Fifty were the leaders of the stock market. In the 1970s, stock selection using Technical Analysis was important, as the market stayed with a trading range for the entire decade. In the 1980s, the market finally broke out of it doldrums, as the DOW broke through 1100 in 1982, and launched the greatest bull market on record.
Sharing is an important aspect of a life. Over 100 people have joined our group, from all walks of life, covering twenty three countries across the globe. It's been the most fun I have ever had in the market. Sharing uncommon knowledge, with investors. In hope of aiding them in finding their financial independence.
Copyright © 2011 Tony Caldaro - All Rights Reserved Disclaimer: The above is a matter of opinion provided for general information purposes only and is not intended as investment advice. Information and analysis above are derived from sources and utilising methods believed to be reliable, but we cannot accept responsibility for any losses you may incur as a result of this analysis. Individuals should consult with their personal financial advisors.
© 2005-2022 http://www.MarketOracle.co.uk - The Market Oracle is a FREE Daily Financial Markets Analysis & Forecasting online publication.