


Stock Market Correction May Be Ending
Stock-Markets / Stock Markets 2011 Mar 14, 2011 - 02:14 AM GMTBy: Andre_Gratian

 Very Long-term trend - The continuing strength in the indices is causing me to question whether we are in a secular bear market or two consecutive cyclical bull/bear cycles. In any case, the very-long-term cycles are down and, if they make their lows when expected, there will be another steep and prolonged decline into 2014-15.
Long-term trend - In March 2009, the SPX began an upward move in the form of a bull market. Cycles point to a continuation of this trend for several more months.
SPX: Intermediate trend - The intermediate trend is still up and does not look in immediate danger of reversing. A short-term correction is taking place, but the index may soon be ready to rise to a new high.
Analysis of the short-term trend is done on a daily basis with the help of hourly charts. It is an important adjunct to the analysis of daily and weekly charts which discusses the course of longer market trends. You can sample some of the previous week's updates at the end of this article.
Long-term trend analysis
Last week, in the Week-end Report, I discussed the cycles which were most likely responsible for the overall market pattern. This week, I want to discuss trend behavior in order to understand where we are in the overall market structure.
All market trends eventually end, but before they do, they usually take a breather (consolidation) or a pause (correction). At some point, the correction will turn out to be a reversal which is the beginning of a trend in the opposite direction. When prices stop rising, the analyst must determine which of these the market is in the process of making. I have previously stated that a clue to the end of a trend is evident deceleration taking place in the prevailing trend which is reflected in the price action and in the indicators. So let's start by looking at the longer term chart to see if we can identify what's going on right now.
We have already determined that the SPX is in an intermediate trend within a long-term trend. Have we reached the end of that intermediate trend and are we starting an intermediate correction? Fortunately, since this is the second intermediate trend of the bull market, we can see how the first came to an end and perhaps derive some clues about how this one might. Both intermediate trends are delineated by blue channel lines with a (dashed) blue mid-channel trend line.
In the first one, the initial correction came at point A and ended at B. The next uptrend stopped at C and corrected to D. I can now draw a trend line between A and C, and a parallel to it at the market low. This gives us the channel in which prices are traveling. After D, the index went to a new high at E, but failed to reach the top of the blue channel - a sign of deceleration. Until then, the price action had essentially remained in the top half of the channel. The E-F correction took the index down to the lower trend line - more deceleration. Finally, F-G could only rise to the mid-channel trend line, more evidence of the weakening intermediate trend which ended at G.
There is no guarantee that the second intermediate trend will follow exactly the same course but, if it does, I have roughly marked on the chart what may lie ahead. Since there is no evidence of deceleration in the trend, the odds that we are making an intermediate top at C are not very high. Perhaps the index will only make it to E, with deceleration showing, and reverse from there. For a confirmed reversal, the index would have to break through the lower channel line. Until it does, we are still in an intermediate uptrend.
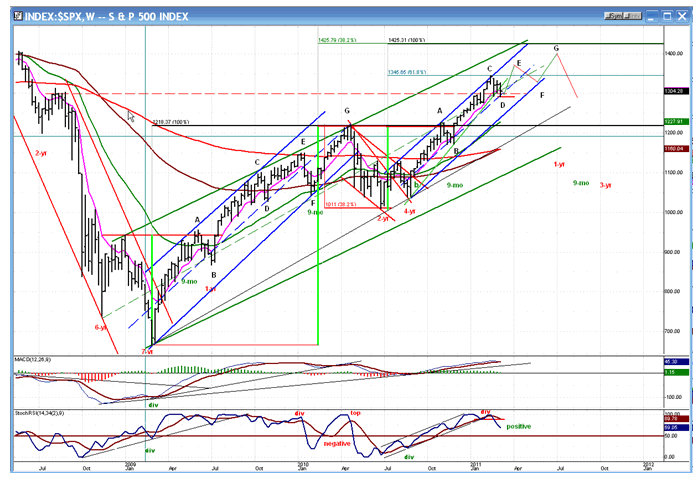
The indicators are still positive, and only the lower one has started to decline. It would have to become negative and stay there in order to signify that we have started an intermediate reversal.
Fibonacci projections are often helpful in determining the end of trends. I have included some of these on the chart. The first intermediate trend came to an end when it had exactly doubled the height of its first phase, and the intermediate correction was exactly .382 of the total intermediate trend.
If the second intermediate trend reaches the extent of the first (Fibonacci-wise) it should end at 1425. Interestingly, 1.382 of the entire first intermediate phase is: 1425! So far, it is probably only pausing at the .618 level. If we make it to 1425 (now or later) that is a level where the bulls should exercise caution.
Short-term trend analysis
We'll now take a look at the daily chart to see if it confirms what we see in the weekly. The chart portrays the current intermediate channel. The SPX is currently in a short-term downtrend and, as witnessed by Friday's rally, has found support on the mid-channel line. The price trend and the indicators are all in a declining mode so, if it has found an important low, the index will have to follow through next week and turn the price and indicators around until it breaks out of its declining channel. If the E phase cannot make it to the top of the channel, it will reflect deceleration and probably drop to the bottom of the channel - and perhaps beyond -- on the next decline.

Micro analysis
The hourly chart is where the reversal of trends is first, and most easily, discerned. Minor trend lines, channels, and resistance and support levels that cannot easily be perceived on the daily chart are very clear on this chart. Of course, this is not guaranteed, but since there was no obvious deceleration taking place on the longer-term charts, our logical "expectations" should be for a short-term correction and not for a prolonged decline. And, the fact that support from the previous low of 2/24 held should encourage the bulls.
On the hourly chart, you can clearly see what needs to be done to reverse the daily trend. After holding support at the 17-wk cycle low, the SPX has already come out of its steepest (black) channel. Our attention should now shift to the gray channel, which is also down, but at a more moderate angle. If we are attempting a reversal, the normal tendency would be to have some minor consolidation, and then to challenge the downtrend lines of the gray channel. The same process should be repeated once more if and when we exit the gray channel, and, before we try to come out of the red channel. If we succeed and overcome the 1330 tops, we can be almost certain that we have re-established the intermediate uptrend.
The index not only found support from the previous low, but that level also corresponded to an internal trend line of the red channel, an extension of a previous trend line, and a prior projection point. On Friday morning, I wrote the following in my Morning Comment to subscribers:
Friday, March 11 -- Morning Comment ...The hourly indicators are nearly ready to signal a rally. How much progress this rally brings will tell us what to expect next. We have a clear downtrend line and channel on both indices and, until they have been broken upward, we remain in a correction. If we don't make it to the top of the down-channel by the end of the rally, we will risk making new lows.
The futures have rallied from their overnight lows, but are still negative. Let's see what the first hour brings. The steepest channel shown on your chart is outlined in black. That's the first one we need to tackle for a rally.
Projection down to 1289-91 is now likely.
The low came at 1291.99. If we hold this level and move out of the gray channel, it will be bullish. On the other hand, if it does not hold and we make a new low, we risk dropping all the way down to the bottom of the red channel.
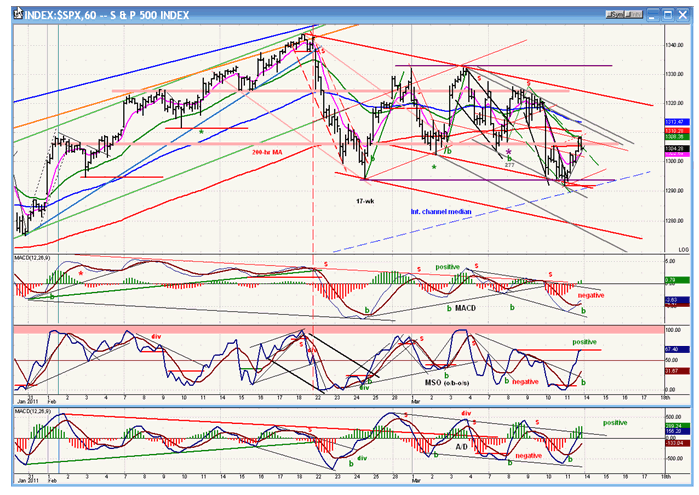
This chart contains much more information than what I have already given you, and is the reason why I love hourly charts. Besides, the hourly indicators are very reliable and continue to amaze me by their predictive value. After they started to turn up, I was sent the following email:
Sent: Friday, March 11, 2011 10:40 AM Subject: Market update
The initial reversal looks good. The A/D has gone positive but still very tentative. If we can get past 1305 decisively on the SPX, there is a good chance that we can reach 1309. Enough of a base has been built to take us all the way to 1330 if we can get some real strength in the A/D. There are trend lines that will have to be broken before we can do this. Let's take it one step at a time. With a low of 1291.99, the SPX essentially met the Fibonacci projection, and this reversal could be the beginning of something bigger, IF we can break the down trend lines that stand in the way.
With a move to 1308.35, the base has been extended and, if we do not break down on Monday, we can now consider a potential projection to 1340.
The hourly indicators are still trending up but could undergo a small consolidation before moving higher. The trend lines on the MACDs correspond to the gray downtrend lines. They will have to be penetrated, and both indices will have to become positive to signal that the short-term uptrend is reversing.
On the chart, there are two pale red bands. These represent resistance which must be overcome for a resumption of the uptrend. Note how the first bounce was contained by the first band (and also by the 1309 projection mentioned in the second email).
Cycles
The important cycles that lie ahead, are shown on the Weekly Chart, above.
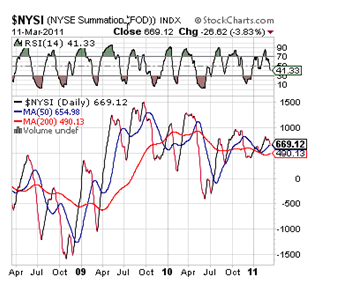
Breadth
The NYSE Summation Index (courtesy of StockCharts.com) is correcting along with the market and not telling us very much one way or the other.
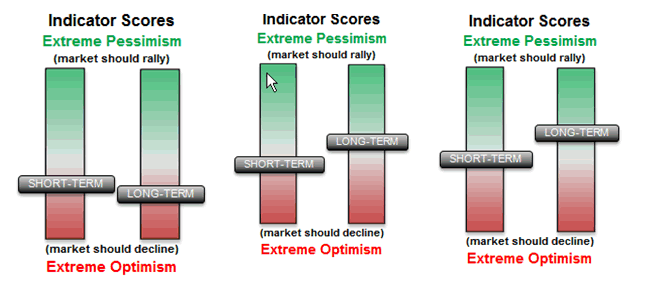
Sentiment
By contrast, the SentimenTrader (below, courtesy of same) has improved substantially over the past month, and this is bullish.
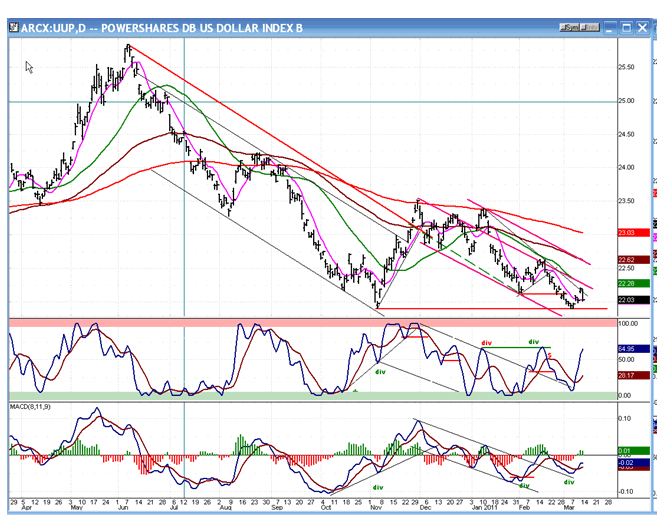
Dollar index
In last week's report, I mentioned that UUP, the dollar ETF, might be ready to reverse. It did, briefly, but will probably need more consolidation before it can sustain an uptrend. The P&F chart of the dollar still calls for a potential 65-66.
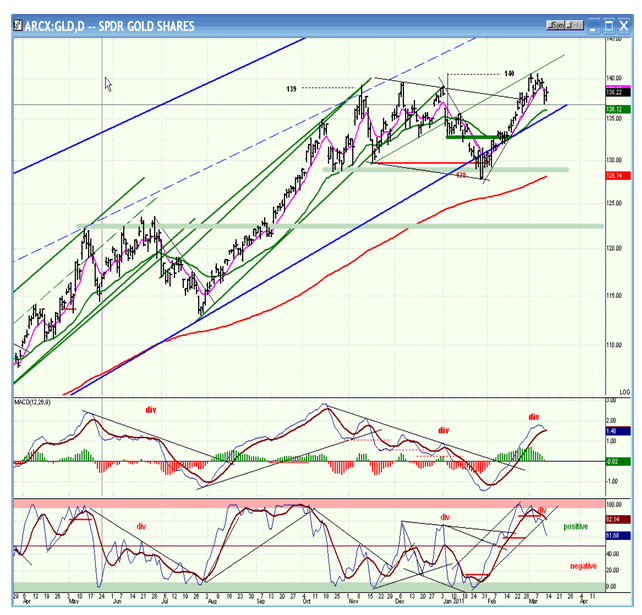
Gold
After correcting from 139 to 128, GLD re-established a small base which had a 140 short-term phase projection. It met that target last week and started backing off. It's still too soon to tell what it will do next, but its daily indicators, although still positive, have turned down and may be signaling a deeper retracement. If that happens, it will soon run into its major trend line again. If that holds, it could possibly extend its move to 144-145 where it could run into intermediate trouble.
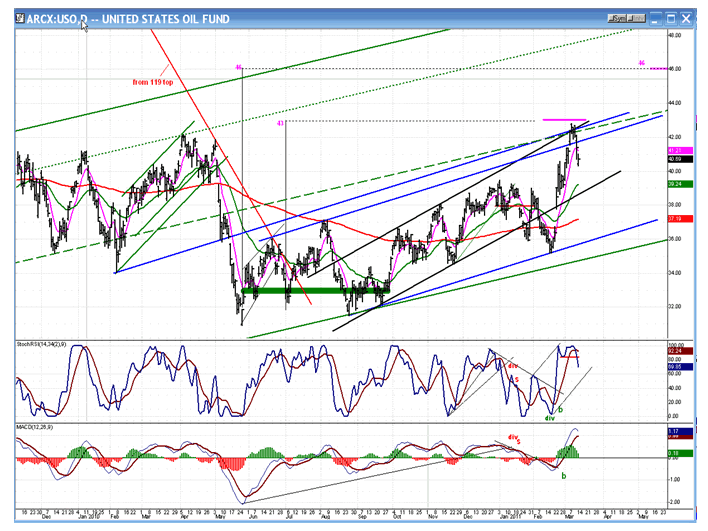
OIL
Last week I started to discuss oil. I showed a chart of USO on which I had drawn trend and channel resistance lines which converged on the level where it was trading (42.33 close). I also mentioned that I had a P&F count to 43 where it might pause, followed by a potential move to 46. The high of the move, last Monday, was 42.83 (close enough to its target). Its low, on Friday, was 40.36.
Since there is a higher count to 46, we should think of this as the beginning of a correction, and not as a final high. In fact, there is also a potential base count to 52, but it may be a weak count since it is due to an extension of the base to the left of the low. These counts are not always reliable, but should be kept in mind, nevertheless, and we should let market tell us where it wants to go from this point on.
Interestingly, the strong base count has a projection of 43! Let's see what happens at this level.
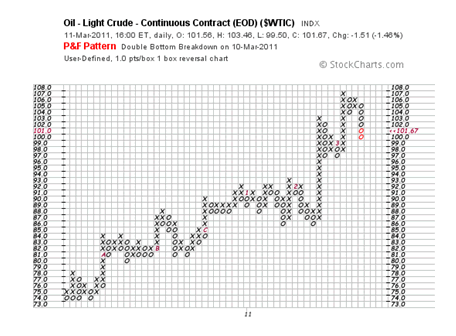
I had also discussed WTIC (light crude continuous contract - EOD). I mentioned that it had a count to 106-107. This is the chart (courtesy of StockCharts.com) that I used to make that projection. You can see where the move stopped and what has happened since. Because neither USO nor WTIC has an extensive distribution top at its recent high, it means that if they are going to retrace more, they will probably have to build a top first.
Summary
Last Friday, the SPX pulled back one more time to the level of its former low of 1195 and, by rallying and closing 10 points above, has essentially made a double-bottom.
It is possible that the index has seen the low of its correction, but in order to confirm this, it will have to start rallying past all the down-trend lines that are in its way. I discussed this in great detail in my analysis of the hourly chart.
FREE TRIAL SUBSCRIPTON
If precision in market timing for all time frames is something which is important to you, you should consider a trial subscription to my service. It is free, and you will have four weeks to evaluate its worth.
For a FREE 4-week trial. Send an email to: ajg@cybertrails.com
For further subscription options, payment plans, and for important general information, I encourage you to visit my website at www.marketurningpoints.com. It contains summaries of my background, my investment and trading strategies and my unique method of intra-day communication with Market Turning Points subscribers.
By Andre Gratian
MarketTurningPoints.com
A market advisory service should be evaluated on the basis of its forecasting accuracy and cost. At $25.00 per month, this service is probably the best all-around value. Two areas of analysis that are unmatched anywhere else -- cycles (from 2.5-wk to 18-years and longer) and accurate, coordinated Point & Figure and Fibonacci projections -- are combined with other methodologies to bring you weekly reports and frequent daily updates.
“By the Law of Periodical Repetition, everything which has happened once must happen again, and again, and again -- and not capriciously, but at regular periods, and each thing in its own period, not another’s, and each obeying its own law … The same Nature which delights in periodical repetition in the sky is the Nature which orders the affairs of the earth. Let us not underrate the value of that hint.” -- Mark Twain
You may also want to visit the Market Turning Points website to familiarize yourself with my philosophy and strategy.www.marketurningpoints.com
Disclaimer - The above comments about the financial markets are based purely on what I consider to be sound technical analysis principles uncompromised by fundamental considerations. They represent my own opinion and are not meant to be construed as trading or investment advice, but are offered as an analytical point of view which might be of interest to those who follow stock market cycles and technical analysis.
Andre Gratian Archive |
© 2005-2022 http://www.MarketOracle.co.uk - The Market Oracle is a FREE Daily Financial Markets Analysis & Forecasting online publication.