


April Key Events And The Outlook For Stocks
Stock-Markets / Stock Markets 2011 Apr 07, 2011 - 07:21 AM GMTBy: John_Hampson

 7th April: ECB rate decision
A rate rise is priced in. The Euro is currently threatening to break out from long term resistance against the US Dollar, but the bearish sentiment against the Dollar suggests a bounce is overdue. If the Euro does break out then Dollar index support levels at 75 and then 72 may provide that Dollar rally. Although Portugal appears to be edging closer to a bailout, the Euro strength reflects the fact that Spain's troubles have eased, as shown in the inverse relationship in the chart below. It appears the markets are confident that bailouts will be limited to the smaller economy nations.
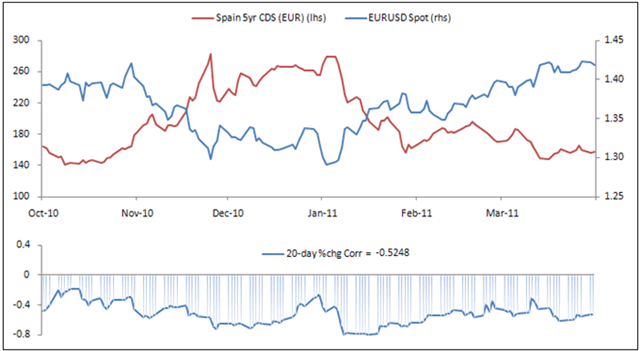
Source: Daily FX
11th April: US earnings season starts
A lack of earnings pre-announcements suggest a lack of earnings surprises, but will earnings be slightly compressed by higher input costs (rising commodities)? If so, higher sales need to have compensated. As energy prices accelerated only late in the quarter, it may be that it is the next season's earnings that face the greater squeeze. Historically high corporate profits suggest disappointing seasons lie ahead, in that a reversion to mean is likely.
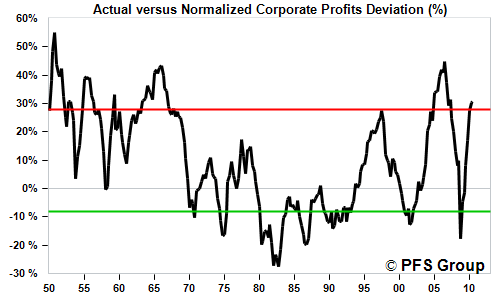
Source: PFS Group
12th April: the new POMO schedule is announced
Fed wording in the April 5th minutes suggested QE2 will be completed in full, ending June 30th, without any tapering down. Fed wording also suggests that they are more concerned with downside economic risks in the second half of 2011 and less concerned with inflation which they see as transitory. Policy should therefore remain easy and loose for the foreseeable future, particularly as that is Bernanke's bias and he, as Fed head, is likely to dictate.
17th April: New moon
Typical stocks weakness into and around the new moon. Plus a window of negative seasonality from 18 to 20 April. If there is to be weakness in April then bringing the two together, 11-20 April would be that period.
27th April: Fed statement on QE
If the Fed makes it clear that QE2 will end in June without any follow through into a QE3 programme (at least not immediately following QE2), then this has the potential to mark a correction in stocks over the summer, from as early as this date or from closer to the end of Spring. There has been little in the Fed wording to suggest QE3 will be announced, although we should not rule out some kind of partial stimulus extension of some form.
--------------------------------------------------------------------------------
The current picture for equities is overall mixed.
On the bullish side, the Hang Seng just has broken out upwards out of its multi-year triangle pattern. The Thai and South Korean indices have just hit new 10 year highs. The US small caps Russell 2000 has hit an all time high, and small caps leading is usually bullish. We have just seen a new Dow theory buy signal. Cumulative Advance-Declines are still strong. April is a seasonally bullish month for stocks historically. We are still in the Presidential cycle sweetspot for equities.
On the bearish side, we see some negative divergence on the internals of the rally, such as volume. There has been some narrowing of sectors leading the market higher, such as energy. Put/call ratios and open interest ratios show excessively bullish readings that have historically been contrarian. Investors Intelligence sentiment has just hit the extreme level historically associated with a reversal, as shown:
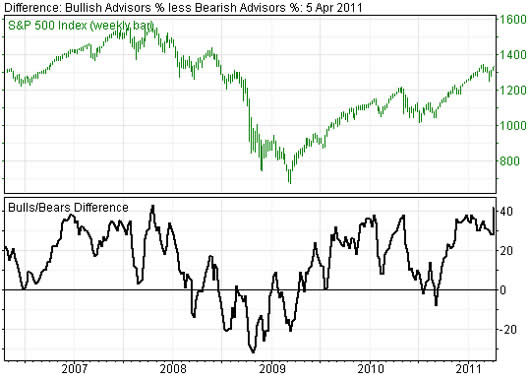
Source: Stocks Traders Almanac
Turning to leading indicators and tipping points, we are seeing some early warning signs of weakening in manufacturing readings and in China, and the impact of rising input prices (see first two charts below). Oil is also still rising and will crimp growth to the tune of 0.2% for each $10 increase, with Brent in particular ($122 at the time of writing) getting to dangerous levels (see third chart). As other models suggest no recession is likely for another 2 years, a period of consolidation or retreat for oil is anticipated. Slack in oil stock inventories left over from the recession is supportive of a pullback or sideways drift.
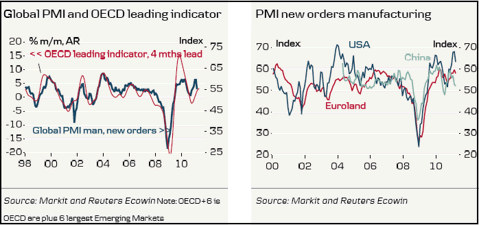
Source: Danske Bank
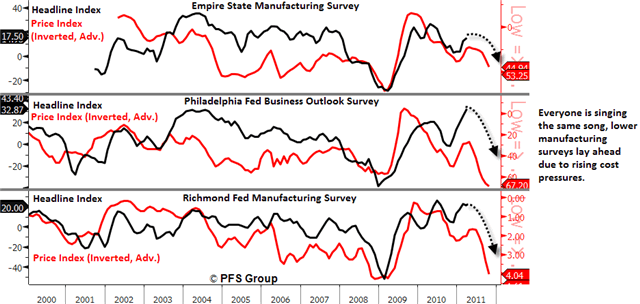
Source: PFS Group
Source: Factset / Schwab
All things considered, I believe we are approaching a point where risk assets take a sustained breather. A US Dollar bounce and a consolidation in oil are due. Rising input prices and the drag from Japan are likely to assist in bringing down corporate profits from their historical extreme. Stocks in this quartile of the cyclical bull are approaching the level of 1350 S&P that I projected as the top end of a June target, comparing historical bulls. Bringing together some early leading indicator weakness, a seasonally weak period for stocks of May-Sep, the likely end of QE in June and the announcement of such at the end of April, a June Puetz crash window, and historic rhymes with 1996-2000 and 2003-2007, I have produced the two forecasts below for the S&P 500. Both forecasts suggest a period of correction and consolidation in mid-2011, but the first suggests a deeper retracement, with around 1200 support, whilst the second suggests a shallower retracement, with around 1275 support. But we may first reach a little higher in April to 1350 or above, before consolidation begins, and I would expect to see more evidence of weakening and contrarian indicators to accompany any such movement higher, to further validate the likelihood of a correction.
John Hampson
John Hampson, UK / Self-taught full-time trading at the global macro level / Future Studies
www.amalgamator.co.uk / Forecasting By Amalgamation / Site launch 1st Feb 2011
© 2011 Copyright John Hampson - All Rights Reserved
Disclaimer: The above is a matter of opinion provided for general information purposes only and is not intended as investment advice. Information and analysis above are derived from sources and utilising methods believed to be reliable, but we cannot accept responsibility for any losses you may incur as a result of this analysis. Individuals should consult with their personal financial advisors.
© 2005-2022 http://www.MarketOracle.co.uk - The Market Oracle is a FREE Daily Financial Markets Analysis & Forecasting online publication.