


Stock Market Should Get Another Attempt at Going Higher
Stock-Markets / Stock Markets 2011 Apr 11, 2011 - 01:37 AM GMTBy: Andre_Gratian

 Current Position of the Market
Very Long-term trend - The continuing strength in the indices is causing me to question whether we are in a secular bear market or two consecutive cyclical bull/bear cycles. In any case, the very-long-term cycles are down and, if they make their lows when expected, there will be another steep and prolonged decline into 2014-15.
Long-term trend - In March 2009, the SPX began an upward move in the form of a bull market. Cycles and P&F projections point to a continuation of this trend for several more months.
SPX: Intermediate trend - The intermediate trend is still up. A short-term correction appears to have completed at 1249.05, and a consolidation is taking place after reaching the first P&F projection of 1335.
Analysis of the short-term trend is done on a daily basis with the help of hourly charts. It is an important adjunct to the analysis of daily and weekly charts which discusses the course of longer market trends.
Market Overview
The summary of the 4/3 Week-end Report stated:
“Last week, because of some overhead resistance, I anticipated a potential pull-back before going higher. There was one, but it was very brief and shallow. The scenario that I had foreseen is more likely to take place now that we have reached the 1334 projection."
As mentioned previously, the market moves in phases, and each phase completion is followed by a consolidation or correction. The Point & Figure chart is the best way to identify these phases, especially the periods of accumulation and distribution which precede them.
When the SPX made its low at 1249, it created an accumulation pattern from which four distinct “counts” can be derived. When each count is attained, a pull-back should take place – at a minimum! Each completed phase count is also capable of producing an important correction instead of a mere consolidation phase. On April 1, the SPX reached its first phase count of 1334 and, although it has slightly exceeded that price level, it has not been able to decisively continue its rally and is clearly making a consolidation pattern which could turn out to be only the beginning of a deeper correction. Some uncertainty is being created by the fact that the QQQ is relatively weaker than the SPX.
When this corrective behavior ends, it could result in an extension of the rally from 1249. Since we have no way of knowing ahead of time which scenario will play out, we need to wait for some clarification and next week’s action should give us some good clues about market direction.
Chart Analysis
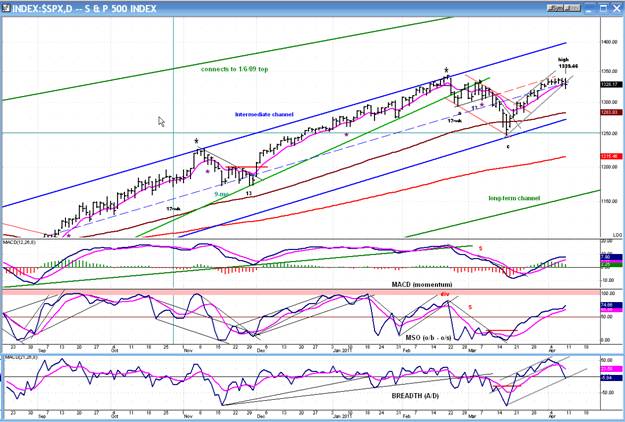
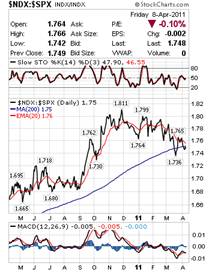
We’ll start with the Daily Chart of the SPX. The price chart itself does not give us a very clear view of the recent action, except to show prices going sideways for that last few days. With the index making a new high on Friday before making a new consolidation low, I have drawn the uptrend line from the 1249 low to Thursday’s low. It was breached on Friday, but this is not a conclusive sell signal.
The indicators are mixed: the MSO is still moving up, the MACD is flattening out, and the A/D has given a sell signal and is in a downtrend.
A couple of things to notice on the price chart: the rally stopped going up, in part because of the resistance caused by a former high and by the (dashed red) extension of a previous short-term support line.
More information can be obtained by comparing the behavior of the QQQ to that of the SPX. The QQQ normally leads, either up or down. Currently it is lagging, which is a yellow flag.
Since only a limited perspective can be obtained from the daily chart, let’s turn to the Hourly Chart which is more detailed and may give us more insight about what comes next.
Here, we can get up-to the minute information which may be particularly significant in this case considering what happened in the last hour of trading on Friday. Up to that point, the index had created a basically sideways channel that had caused the indicators to start a downtrend in which they remained until the end of the week. This consolidation has been taking place within a larger up-channel (green).
On Friday, after making a fractional new high at the opening, the SPX started a decline which broke below the mid up-channel trend line and made a 5-day low creating an apparent acceleration of the downtrend. However, in the last hour it had a 6-point reversal which formed some positive divergence in the NYSE A/D indicators. The divergence is only minor, but since this is how reversals tend to occur, what happens on Monday will be important. A confirming buy signal has yet to appear in the indicators, but this could easily come on Monday if there is enough follow through on the upside.
Something else which suggests that the consolidation could have ended is that, by making even a fractional new high on Friday, the index may have invalidated the distribution phase which had formed prior to Thursday and which carried a potential projection to about 1305.
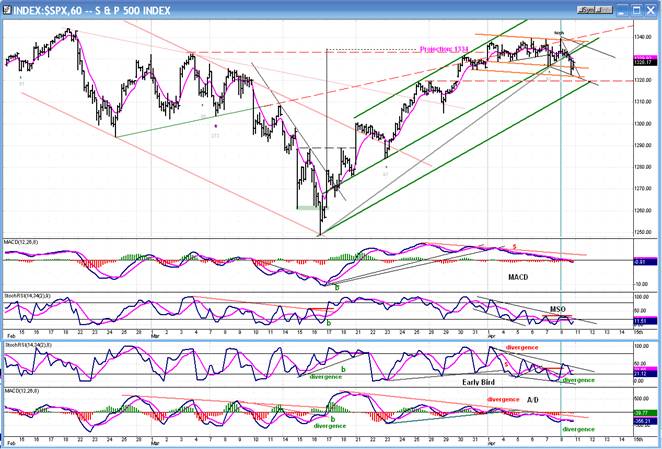
In order to demonstrate that the SPX is ready to resume its uptrend, it must now start a move which lasts several days and carries decisively beyond the former short-term highs. This action must be supported by very positive A/D.
Projections
Friday’s new fractional high may have invalidated the distribution phase formed over the past 5 days. However, a small shelf across the 1333 level did create a projection which was reached at 1323.
On the upside, there could be a follow through to 1335 and, if 1339 is surpassed, 1344 may be next.
Cycles
I am not aware of any short-term cycle which could have an immediate influence on the market.
The longer-term cycles which bottomed in 2009 and 2010 are continuing their upward pressure.
Breadth
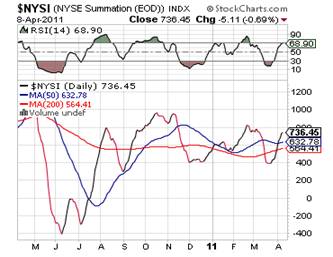
This is a chart of the NYSE Summation Index (courtesy of StockCharts.com). A couple of weeks ago, some negative divergence began to show vs. SPX. This has now dissipated and the index is back to neutral.
Sentiment
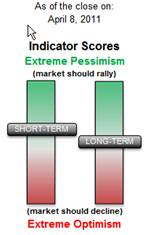
The SentimenTrader (below, courtesy of same) long-term index has dropped down to about neutral. The short-term reading has risen to the bullish side and adds some credibility that a low of some sort was made on Friday, with a potential extension of the bounce on Monday.
I have already mentioned that the QQQ (NDX) was lagging the SPX. The following chart (courtesy of MarketChart.com) makes this very obvious. That could mean that the consolidation is not over. A more negative scenario would be a break-out above 1339 that fails to get past 1344.
The negativity of this index is offset by the still neutral/positive readings of the SentimenTrader.
Dollar index
The dollar has continued to decline and has broken another short-term support level. It has now reached its P&F projection of 75.00 (or fractionally lower). If it is going to reverse and create a base, this is the logical level from which to do it. If there is further weakness, I would have to re-assess my expectations.
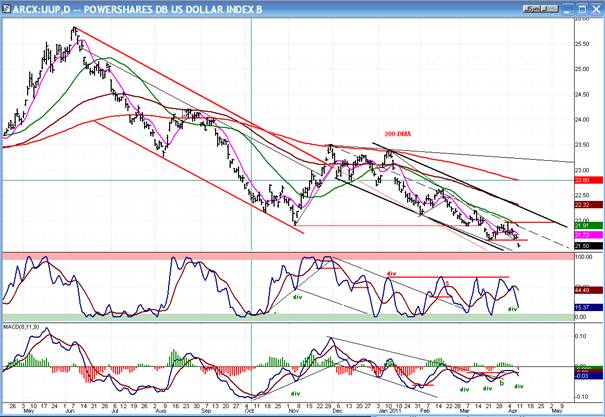
Although they are again in a downtrend, some positive divergence remains in the indicators. If they turn back up before losing this divergence, it would begin to suggest a low has been reached.
Gold
Fueled by a weak dollar, gold has continued to rise, and this has taken GLD, the gold ETF, to its 144-145 projection.
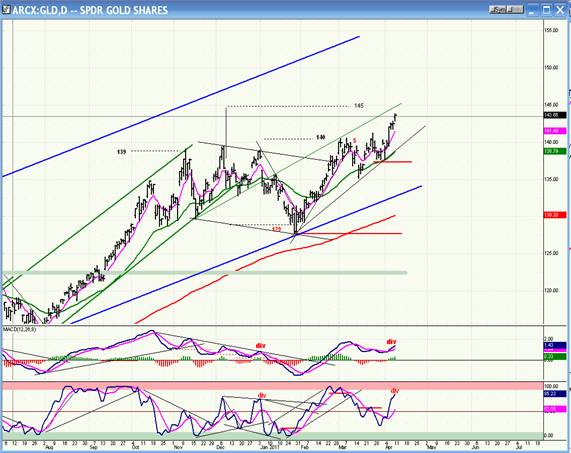
The negative divergence which has built up in the indicators adds credibility to the target as a valid count. Should GLD move past that level, the next projection would be148-150.
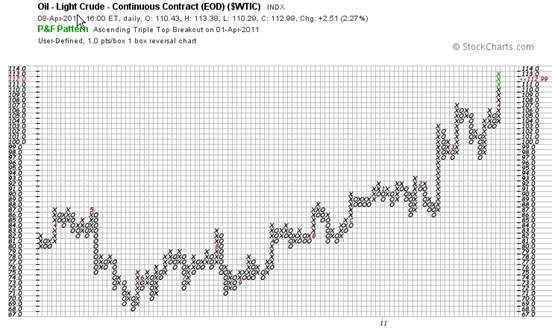
OIL
Previously:
From the re-accumulation Point & Figure chart pattern of WTIC we had derived a conservative count to 107-109. This is where the index went before finding sellers which took it down ten points. It has since rallied and may be ready to move higher, or do some additional consolidation first. There is a more liberal count to 115 which could be reached eventually.
Oil has also benefitted, among other things, from the dollar’s weakness. After a brief consolidation after reaching 107, it quickly made new highs
The Point & Figure chart of WTIC (courtesy of StockCharts.com) shows that after reversing its decline to 68, crude oil formed a re-accumulation base from which we can take a very clear count across the 76 level, and this gives us a projection to 115.
On Friday, WTIC reached 113.88 intraday, thus coming very close to its 115 target. A significant reversal could come from this level.
Also previously:
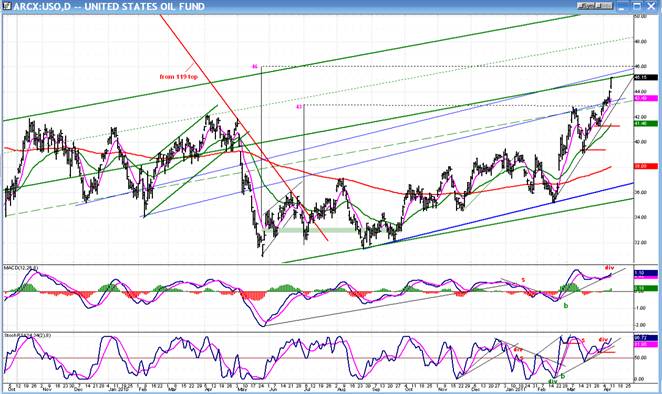
USO (below) also met with selling when it reached its first projection of 43. Since the price has rallied back to its resistance lines and the indicators are not especially bullish, it may undergo additional consolidation before trying for the 46 projection (which corresponds to 115 in WTIC).
Following on the tracks of crude, USO closed at 45.15 on Friday, less than a point away from its projection. It’s fair to say that if WTIC stops at 115 -- or just a little shy of it -- USO will also reverse at, or near, its 46 target.
There is a longer term projection taken across the base which could eventually propel USO to 52, but not before it has a substantial correction.
Summary
Since appropriate news always seem to appear in connection with long-term cycle lows and price projections, the close call on the budget impasse was probably related to the SPX 1334 target and its following consolidation. With agreement ostensibly achieved, we should get another attempt at going through the 1339 high.
However, there are some negatives in the background which could extend the corrective process before it ends. According to Raymond Merriman – one of the best financial astrologers – the conditions which brought about the current market weakness could extend a little longer.
There is a well-established inverse correlation between the dollar and some commodities such as oil and gold. With each of these three indices respectively reaching what appear to be valid short-term targets, it will be interesting to see how they behave next week.
FREE TRIAL SUBSCRIPTON
If precision in market timing for all time frames is something which is important to you, you should consider a trial subscription to my service. It is free, and you will have four weeks to evaluate its worth.
For a FREE 4-week trial. Send an email to: ajg@cybertrails.com
For further subscription options, payment plans, and for important general information, I encourage you to visit my website at www.marketurningpoints.com. It contains summaries of my background, my investment and trading strategies and my unique method of intra-day communication with Market Turning Points subscribers.
By Andre Gratian
MarketTurningPoints.com
A market advisory service should be evaluated on the basis of its forecasting accuracy and cost. At $25.00 per month, this service is probably the best all-around value. Two areas of analysis that are unmatched anywhere else -- cycles (from 2.5-wk to 18-years and longer) and accurate, coordinated Point & Figure and Fibonacci projections -- are combined with other methodologies to bring you weekly reports and frequent daily updates.
“By the Law of Periodical Repetition, everything which has happened once must happen again, and again, and again -- and not capriciously, but at regular periods, and each thing in its own period, not another’s, and each obeying its own law … The same Nature which delights in periodical repetition in the sky is the Nature which orders the affairs of the earth. Let us not underrate the value of that hint.” -- Mark Twain
You may also want to visit the Market Turning Points website to familiarize yourself with my philosophy and strategy.www.marketurningpoints.com
Disclaimer - The above comments about the financial markets are based purely on what I consider to be sound technical analysis principles uncompromised by fundamental considerations. They represent my own opinion and are not meant to be construed as trading or investment advice, but are offered as an analytical point of view which might be of interest to those who follow stock market cycles and technical analysis.
Andre Gratian Archive |
© 2005-2022 http://www.MarketOracle.co.uk - The Market Oracle is a FREE Daily Financial Markets Analysis & Forecasting online publication.