Agri-Food's Commodities Bubble?
Commodities / Agricultural Commodities Apr 18, 2011 - 02:29 PM GMTBy: Ned_W_Schmidt
 A big question should be on the mind of investors. Is it 2008 all over again? Are we witnessing another commodity price bubble driven by speculation in paper commodities? With Silver clearly in a speculative bubble, allowing value investors to liquidate positions at overly inflated prices, one might think so. With paper oil ignoring the weakness in physical oil demand, one might be almost sure of it. When mob panics and dumps ~$800 million into GLD, one might need to start reconsidering one's ownership of some inflated commodities.

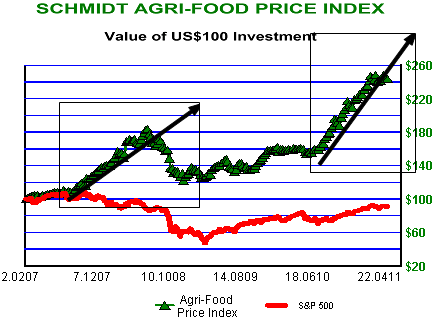
Plotted in the above chart, the Agri-Food Price Index recently made a new high. Despite that sign of encouragement, the more recent retreat in Agri-Commodity prices means the index is no higher than six weeks ago. In short, Agri-Commodity prices, on average, have made no progress in more than a month.
Further, the median-based index, rather than the mean-based index above, continues to under perform, and move lower. That situation is usually an indication of internal weakness within a market. It is much like the breadth moving lower in a stock market when the indices are still advancing. Only 2 of 15 commodities comprising the above index are at new 90-week highs. That too suggests internal weakness.
Dominating the action in near all commodities has been that of oil. Despite the loss of Libyan production, demand for Saudi Arabian oil is reported as about normal, to perhaps weak. As reported by Reuters from cnbc.com, and confirming previous reports from Financial Times, "Saudis Slash Oil Output; Say Market Oversupplied," 18 Apr 2011,
"Saudi Arabia's oil minister said on Sunday the kingdom had slashed output by 800,000 barrels per day in March due to oversupply, . . ." [Emphasis added.]
Gasoline demand is faltering in the U.S., down from a year ago for the first time since 2008. Are you filling your tank to the top when you go the station? Apparently, like the mythical silver shortage, the only shortage of oil is in the fantasies of paper commodity traders.
Corn has been especially strong of the Agri-Commodities. Its trend ranks number two of fifteen. While the U.S. corn market is fairly short of supply till the Fall harvest, the Fall harvest will occur. At that time the supply situation, while still not in over abundance, will improve. Second derivatives are always dominant, and the second derivative will be moving toward positive on supply at that time.
What has been driving corn prices is a rather loose connection of corn prices to oil. If oil prices rise, traders reason, the price of ethanol should have strength. If the price of ethanol remains strong, the price of corn should remain strong. When trading corn, the traders are not trading corn but trading oil. Weakness in oil prices, which is quite likely, could cause corn prices to lose some support. That might cause some weakness in the entire Agri-Commodity complex. That, of course, would not change the decidedly longer term short supply of Agri-Food.
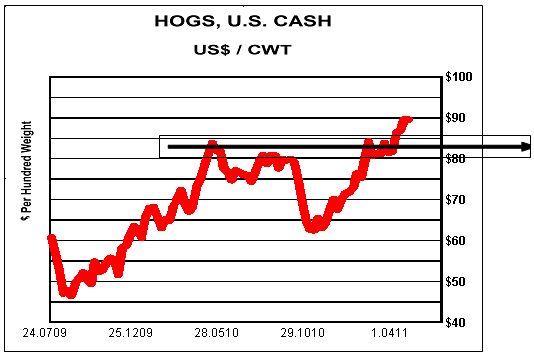
However, as is the case with all markets, some pockets of potential exist. Hog prices and Chinese dairy prices are two examples where that potential might exist. In the following chart the cash prices of U.S. hogs are plotted.

Globally, hog producers had a miserable number of years through the middle of 2009. Disease, high grain prices, and economic collapse all contributed to despair in the industry rather than happiness. After more than five years of rationalizing production, hog producers seem to have finally brought down productive capacity to a level more aligned with demand. Further, China's demand for meat continues to expand, and that nation is the largest pork consumer.
When looking at the above chart, a simple question arises. Are hog prices about to break out to the upside? Summer in the Northern Hemisphere is a seasonally strong period for pork demand. Trends in China suggest a continued contraction of small hog producers. They can make more money working in a factory, a far more pleasant environment.
Almost universally hog producers around the world seem better positioned for a period of improving prosperity. Investors should spend some time researching hog and pork related Agri-Equities. Those Chinese Agri-Equities involved in hog/pork production seem the best positioned to profit from this situation.
By Ned W Schmidt CFA, CEBS
AGRI-FOOD THOUGHTS is from Ned W. Schmidt,CFA,CEBS, publisher of The Agri-Food Value View, a monthly exploration of the Agri-Food grand cycle being created by China, India, and Eco-energy. To contract Ned or to learn more, use this link: www.agrifoodvalueview.com.
Copyright © 2010 Ned W. Schmidt - All Rights Reserved
Ned W Schmidt Archive |
© 2005-2022 http://www.MarketOracle.co.uk - The Market Oracle is a FREE Daily Financial Markets Analysis & Forecasting online publication.


