


Stock Market Ready for a Minor Pullback Before Going Higher
Stock-Markets / Stock Markets 2011 Apr 25, 2011 - 03:05 AM GMTBy: Andre_Gratian

 Very Long-term trend – The continuing strength in the indices is causing me to question whether we are in a secular bear market or two consecutive bull/bear cycles. In any case, the very-long-term cycles are down and, if they make their lows when expected, there will be another steep and prolonged decline into 2014-15.
Long-term trend - In March 2009, the SPX began a move which evolved in a bull market. Cycles point to a continuation of this trend for several more months.
SPX: Intermediate trend – The intermediate trend is still up. A short-term correction completed at 1249.05 and the SPX is now ready to move to new highs.
Analysis of the short-term trend is done on a daily basis with the help of hourly charts. It is an important adjunct to the analysis of daily and weekly charts which discusses the course of longer market trends.
Daily market analysis of the short term trend is reserved for subscribers. If you would like to sign up for a FREE 4-week trial period of daily comments, please let me know at ajg@cybertrails.com
Market Overview
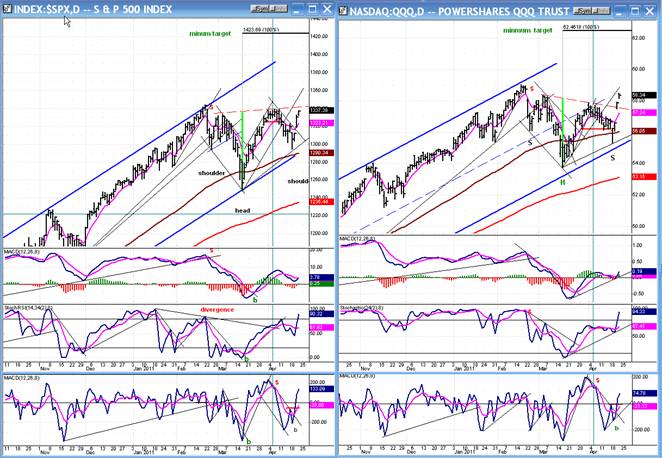
The SPX and QQQ have completed a short intermediate-term correction in what appears to be a reverse Head & Shoulders pattern and, after completing the right shoulder on Monday morning, the indices rocketed upward. If the pattern is confirmed as valid by future action, the traditional measurement of the break-out move calls for a minimum target of about 1425 for the SPX, and one of 62.50 for the QQQ. Since these projections pretty much coincide with the ones that I derive from the Point & Figure bases for the two indices, it increases the odds of their being valid.
At the level of the “head” of the H&S pattern, the SPX built a base formation which gave us several distinct phases on the P&F chart. As mentioned before, the most conservative one generated a target of 1334. After finding its low point at 1249.05, the index rose to 1339 before correcting. Now that the first correction is over, the SPX should rise to its next phase projection, which is about 1370, before the next meaningful consolidation takes place. Since we have just undergone a two-month intermediate correction, the next one could be of shorter duration.
There will be minor corrections along the way to 1370 as shorter phases in the overall structure are completed. In fact, there are many signs that we are ready for the first minor consolidation from the low of 1295 on 4/18. We’ll analyze these on the hourly chart later on but first, let’s look at the Daily Charts of the SPX and the QQQ.
Chart Analysis
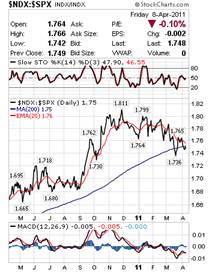
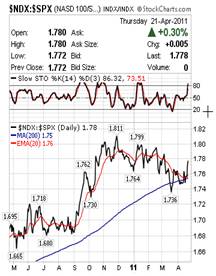
The two charts are placed side by side for easier comparison. The QQQ was a little behind, but is now catching up quickly -- which is a positive. The H&S patterns have been identified on both charts, along with the minimum upside targets. As mentioned earlier, these closely coincide with the P&F projections established at the last two base formations in mid-March and mid-April.
Both indices are now giving buy signals on a daily basis. The SPX has not yet overcome its former short-term high and has not confirmed the H&S pattern by rising above the neckline. But all three of the indicators have turned up, and the second indicator -- which tends to lead – is showing plenty of momentum and has overcome its previous top. I could say that the other two are showing negative divergence but, since they tend to move more slowly, I will give them time to catch up.
In order to give a sell signal, both indices would have to move below the trend line which connects their two recent low points. That’s a long way away, and we will certainly see some negative signs appear before this happens.
We will now analyze the Hourly Chart. After the SPX made its low at 1249.05, it started an uptrend (green channel) which, after a series of minor corrections, reached its conservative base count of 1334 and surpassed it by 5 points. The base from which the count was taken is marked in light green on the chart.
After touching 1339 several times and forming a small distribution top, the index started to correct, broke out of its channel, and continued the correction to 1295 before reversing. That fell short of the potential 1286 count that had been projected by the total distribution top.
The declining process formed a (gray) declining channel and a (gray) re-accumulation base from which the index broke out with gusto on 4/20, a move which took it directly to the first phase projection of 1330. There it consolidated briefly before proceeding to the next target of 1339.
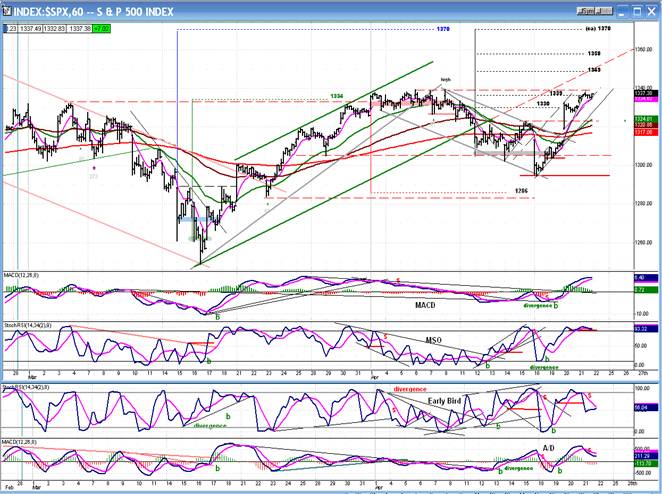
On the chart, I have included the phase projections for the move which started at 1295 and which lead to the final target of (ca)1370. As each one of these is met, there may be a minor correction before moving on to the next. If the market has limited strength, any one of these levels could become the high of the move. Note that the 1370 projection was also inherent in the (blue) base which formed in mid-March. That would make the current projection from 1295 to that level a confirming count. As the uptrend develops, it is common for higher re-accumulation levels to confirm counts that were obtained from the original base.
With the 4/20 breakout, the hourly indicators gave strong buy signals and moved to the top of their ranges. As of Thursday, the two lower ones (A/D) had already given a sell signal, but the momentum indicators had not yet followed suit. This means that the SPX could reverse from 1337.49, just a little shy of the 1339 projection, or it could touch the latter on Monday before turning down. Based on a different projection, there is also a slight chance that we could continue to 1343 before ending the move.
Projections
The projections for this phase of the move consist of the H&S projection and those obtained as a result of the P&F counts derived from the re-accumulation pattern. Both were given earlier.
Cycles
Credit for the cycle(s) which bottomed on 4/18 goes to Eric Haddick. He was right on.
There should be a minor cycle bottoming on 4/25-26, and another one on 4/29-5/2. I don’t see any important cycle making its low until the second half of the year.
Breadth
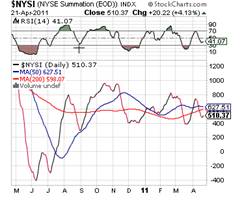
The NYSE Summation Index (courtesy of StockCharts.com) has just begun to turn up and is making a higher low in conjunction with the market. It’s too soon to make a forecast based on its current position. Let’s take another look in a couple of weeks.
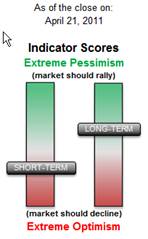
Sentiment
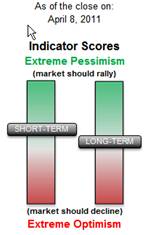
The long-term position of the SentimenTrader (below, courtesy of same) has become more positive, which is a sign that the intermediate uptrend is still healthy.
The short-term is giving us the same cautious warning as the indicators on my hourly chart, above
On the chart below (courtesy of StockCharts.com), you can see how the NDX has begun to improve over the SPX in the past two weeks – a positive sign. We’ll want to keep track of this improvement.
Dollar index
The dollar has been declining steadily for almost 5 months, going from 81 to 74. This is the second leg of a larger decline which started at 88 in June 2010. Because of the P&F chart configuration, I have been looking for a potential end to this decline, even if it is only temporary.
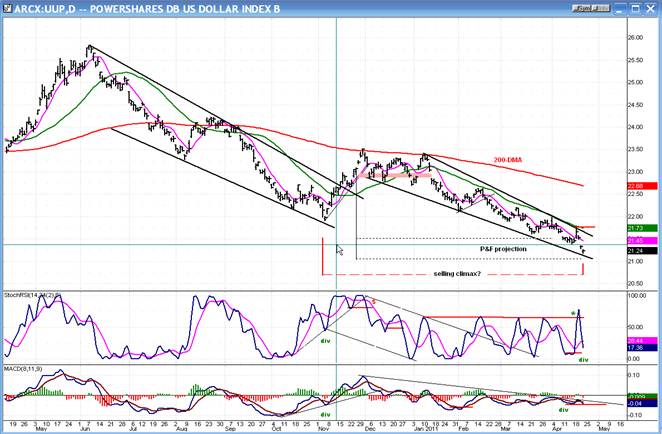
On the dollar P&F chart, I came up with two separate counts to 74 which were met on Thursday.
The above chart is that of the UUP, the dollar ETF. It, too, has reached its P&F projection. Friday’s price action is very similar to the climactic low which took place in early November and marked the end of the decline from the June high. The main difference is that there was some strong positive divergence in the indicators in November, and that there is practically none at Thursday’s low.
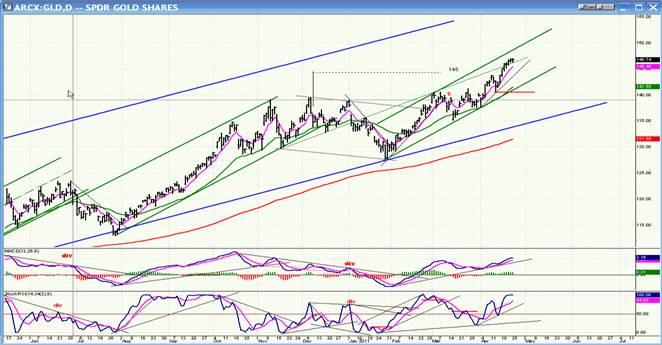
Gold
With the dollar making new lows, GLD has followed the lead of gold and moved higher. In the last letter I mentioned that if GLD went past 145, it could make it to 148. Reaching 147 on Thursday has erased the negative divergence that was showing in both indicators. Since that divergence is gone, the index may not be ready to reverse right away and may have to re-create it before it can find its high point. This would mean printing 148, and perhaps 150.
The reason I put some credibility in a reversal from this level is that the P&F chart has a valid count taken across the 84 base to 145-148. That count is re-affirmed by the smaller counts across 132 and 139.
Oil
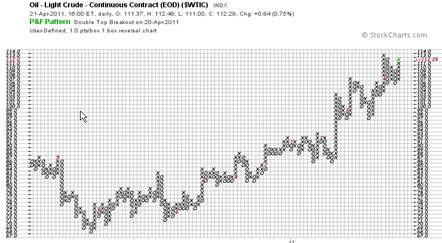
Oil has also benefited from the dollar’s demise, but not enough to make a new high. It may yet, since there is a count at the 76 level which can take it up to 115, and its high, so far, has only been 113. If the dollar starts to rally from Thursday’s low, it may not make it up to 115. Let’s see!
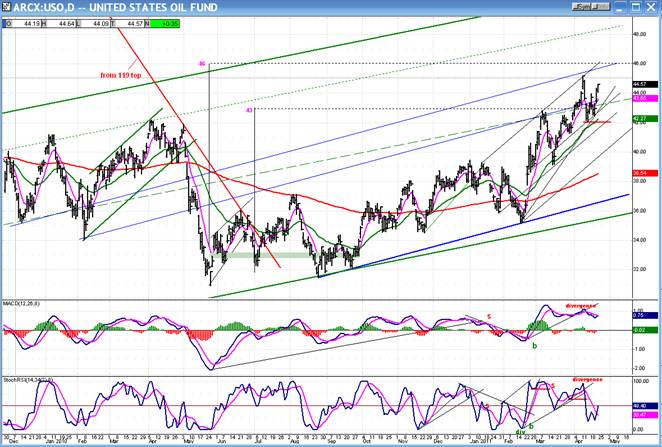
USO, like WTIC, also fell a little short of its 46 projection before pulling back. It has also rallied along with WTIC and is about a point away from its former high. Its continued rise will depend, to some extent, on what the dollar does.
Summary
After reaching its 1334 conservative projection, the SPX corrected over a two-week period and has now resumed its uptrend, confirming the low it made at 1249. From the February high, the correction has taken the form of an inverse H&S pattern, which is very bullish if it proves to be valid. Since it has not yet risen above the neckline, the SPX pattern remains unconfirmed. But it’s probably only a matter of time before it is, because QQQ has an almost identical H&S formation which has already been confirmed.
Short-term, the SPX has a P&F projection target of 1270. Near-term, the rally from 1295 may already have ended, making it ready for a minor pull-back before moving higher.
Andre
FREE TRIAL SUBSCRIPTON
If precision in market timing for all time frames is something which is important to you, you should consider a trial subscription to my service. It is free, and you will have four weeks to evaluate its worth.
For a FREE 4-week trial. Send an email to: ajg@cybertrails.com
For further subscription options, payment plans, and for important general information, I encourage you to visit my website at www.marketurningpoints.com. It contains summaries of my background, my investment and trading strategies and my unique method of intra-day communication with Market Turning Points subscribers.
By Andre Gratian
MarketTurningPoints.com
A market advisory service should be evaluated on the basis of its forecasting accuracy and cost. At $25.00 per month, this service is probably the best all-around value. Two areas of analysis that are unmatched anywhere else -- cycles (from 2.5-wk to 18-years and longer) and accurate, coordinated Point & Figure and Fibonacci projections -- are combined with other methodologies to bring you weekly reports and frequent daily updates.
“By the Law of Periodical Repetition, everything which has happened once must happen again, and again, and again -- and not capriciously, but at regular periods, and each thing in its own period, not another’s, and each obeying its own law … The same Nature which delights in periodical repetition in the sky is the Nature which orders the affairs of the earth. Let us not underrate the value of that hint.” -- Mark Twain
You may also want to visit the Market Turning Points website to familiarize yourself with my philosophy and strategy.www.marketurningpoints.com
Disclaimer - The above comments about the financial markets are based purely on what I consider to be sound technical analysis principles uncompromised by fundamental considerations. They represent my own opinion and are not meant to be construed as trading or investment advice, but are offered as an analytical point of view which might be of interest to those who follow stock market cycles and technical analysis.
Andre Gratian Archive |
© 2005-2022 http://www.MarketOracle.co.uk - The Market Oracle is a FREE Daily Financial Markets Analysis & Forecasting online publication.