


Does Unreal GDP Data Drive Our Economic Policy Choices?
Economics / Economic Statistics May 10, 2011 - 03:54 AM GMTBy: John_Mauldin

 I am back from Rob Arnott's conference in Laguna Beach, and I must confess that if I had attended it before I wrote last week's e-letter I might have had lower odds on the US political class solving the debt crisis, absent a real economic crisis forcing them to. There were several presentations that made the problems quite clear. It remains a tough issue.
This week's Outside the Box is a recent white paper by Rob, where he argues that the traditional way we look at GDP is flawed, because it overstates what is happening in the real, private part of the economy, which is the productive part. Government spending is either money collected from the private sector in the form of taxes or borrowed money that future generations must repay. While not likely to become a mainstream economic view, this is very useful for our own thinking about what constitutes productivity and investments. This is a short but powerful piece from one of America's most honored economic writers.
And let me note that I will be speaking at the annual Agora Financial Investment Symposium, perhaps the only conference in the country where I am the bull in the crowd. It is July 26-29 in Vancouver. You can find out more and register at http://www.agorafinancial.com/reports/vancouver/2011/afis2011b.php. If you come, be sure and say hello.
Have a great week. It is good to be home. I am off to see the Texas Rangers, after a happy hour with David Tice of Prudent Bear fame. And I must say that watching the Mavericks-Lakers game Sunday from the Admiral's Club in LA, while waiting for my plane, was quite fun. Not as good as being there, but fun!
Your trying to remember there is more to life than economics analyst,
John Mauldin, Editor Outside the Box
Does Unreal GDP Drive Our Policy Choices?
Gross Domestic Product is used to measure a country's economic growth and standard of living. It measures neither. Unfortunately, the finance community and global centers of power are wedded to a measure that bears little relation to reality, because it confuses prosperity with debt-fueled spending.
Washington is paralyzed by fears that any withdrawal of stimulus, whether fiscal or monetary, whether by the Administration, the Fed, or the Congress, may clobber our GDP. And they're right. But, GDP is the wrong measure.
Without an alternative, we will continue to make bad policy choices based on bad data. Eventually, our current choices may wreak havoc with our future prosperity, the future purchasing power of the dollar, and the real value of U.S. stocks and bonds.
What is GDP?
GDP is consumer spending, plus government outlays, plus gross investments, plus exports minus imports. With the exception of exports, GDP measures spending. The problem is GDP makes no distinction between debt-financed spending and spending that we can cover out of current income.
Consumption is not prosperity. The credit-addicted family measures its success by how much it is able to spend, applauding any new source of credit, regardless of the family income or ability to repay. The credit-addicted family enjoys a rising "family GDP" -- consumption -- as long as they can find new lenders, and suffers a family "recession" when they prudently cut up their credit cards.
In much the same way, the current definition of GDP causes us to ignore the fact that we are mortgaging our future to feed current consumption. Worse, like the credit-addicted family, we can consciously game our GDP and GDP growth rates -- our consumption and consumption growth -- at any levels our creditors will permit!
Consider a simple thought experiment. Let's suppose the government wants to dazzle us with 5% growth next quarter (equivalent to 20% annualized growth!). If they borrow an additional 5% of GDP in new additional debt and spend it immediately, this magnificent GDP growth is achieved! We would all see it as phony growth, sabotaging our national balance sheet -- right? Maybe not. We are already borrowing and spending 2% to 3% each quarter, equivalent to 10% to 12% of GDP, and yet few observers have decried this as artificial GDP growth because we're not accustomed to looking at the underlying GDP before deficit spending!
From this perspective, real GDP seems unreal, at best. GDP that stems from new debt -- mainly deficit spending -- is phony: it is debt-financed consumption, not prosperity. Isn't GDP, after excluding net new debt obligations, a more relevant measure? Deficit spending is supposed to trigger growth in the remainder of the economy, net of deficit-financed spending, which we can call our "Structural GDP." If Structural GDP fails to grow as a consequence of our deficits, then deficit spending has failed in its sole and singular purpose.¹
Of course, even Structural GDP offers a misleading picture. Our Structural GDP has grown nearly 100-fold in the last 70 years. Most of that growth is due to inflation and population growth; a truer measure of the prosperity of the average citizen must adjust for these effects. Accordingly, let's compare real per capita GDP with real per capita Structural GDP.
A New Measure of Prosperity
Real per capita GDP has recovered to within 2.5% of the 2007 peak of $48,000 (in 2010 dollars). So, why do we feel so bad? For one thing, after two recessions, we're up barely 6% in a decade. Furthermore, this scant growth is entirely debt-financed consumption. The real per capita Structural GDP, after subtracting the growth in public debt, remains 10% below the 2007 peak, and is down 5% in the past decade. Net of deficit spending, our prosperity is nearly unchanged from 1998, 13 years ago.
As a diagnostic for why this has happened, let's go one step further. Few would argue that a healthy economy can grow without the private sector leading the way. The real per capita "Private Sector GDP" is another powerful measure that is easy to calculate. It nets out government spending -- federal, state, and local. Very like our Structural GDP, Private Sector GDP is bottom-bouncing, 11% below the 2007 peak, 6% below the 2000-2003 plateau, and has reverted to roughly match 1998 levels.
Figure 1 illustrates the situation. Absent debt-financed consumption, we have gone nowhere since the late 1990s.
Figure 1. Real GDP, Structural GDP, and Private Sector GDP, Per Capita, 1944-2011
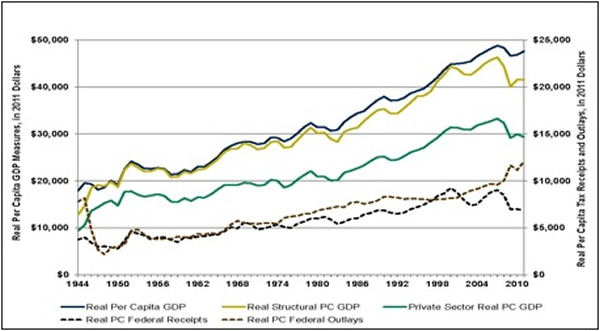
Source: Research Affiliates
As the private sector has crumbled, and Structural GDP has lost 13 years of growth, tax receipts have collapsed. Real per capita federal tax receipts have tumbled to levels first achieved in 1994, and are fully 25% below the peak levels of 2000.² The 2000 peak in tax receipts was, of course, bolstered by unprecedented capital gains tax receipts following the wonder years of the 1990s. But this surge in tax receipts fueled a perception -- even in a Republican-dominated government! -- that there was money to burn, as if the capital gains from the biggest bull market in U.S. stock market history would continue indefinitely!
What does this mean for the citizens and investors in the world's largest economy? If we continue to focus on GDP, while ignoring (and even facilitating) the decay of our Structural GDP and our Private Sector GDP, we'll continue to borrow and spend, mortgaging our nation's future. The worst case result could include the collapse of the purchasing power of the dollar, the demise of the dollar as the world's reserve currency, the dismantling of the middle class, and a flight of global capital away from dollar-based stocks and bonds.
None of these consequences is likely imminent. But, few would claim today that they are impossible. Most or all of these consequences can likely still be avoided. But, not if we hew to the current path, dominated by sheer terror at the thought of a drop in top-line GDP.
After World War II, the U.S. Government "downsized" from 43.6% of GDP to 11.6% in 1948 (under a Democrat!). Did this trigger a recession? Measured by GDP, you bet! From 1945 to 1950, the nation convulsed in two short sharp recessions as the private sector figured out what to do with all the talent released from government employment, and real per capita GDP flat-lined. But, underneath the pain of two recessions, a spectacular energizing of the private sector was underway. From the peak of government expenditure in 1944 until 1952, the per capita real Structural GDP, the GDP that was not merely debt-financed consumption, soared by 87%; the Private Sector GDP, in per capita real terms, jumped by more than 90%.
Was the recent 0.5% drop in GDP in the United Kingdom a sign of weakness, or was this drop merely the elimination of 0.5% of debt-financed GDP that never truly existed? Spending dropped by over 1% of GDP; Structural GDP was finally improving!
We must pay attention to the health -- or lack of same -- for our Structural GDP and our Private Sector GDP before they lose further ground.
Conclusion
Government outlays were not reined in by either political party for most of the past decade. Real per capita government outlays now stand some 50% above the levels of just 10 years ago, even with Structural GDP and Private Sector GDP down over the same span. Federal spending is more than 40% of the Private Sector GDP for the first time since World War II.
Even our calculation of the national debt burden (debt/GDP) needs rethinking. Is the family that overextends correct in measuring their debt burden relative to their income plus any new debt that they have accumulated in the past year? Isn't it more meaningful to compute debt relative to Structural GDP, net of new borrowing?! Our National Debt, poised to cross 100% of GDP this fall, is set to reach 112% of Structural GDP at that same time, even without considering off-balance-sheet debt.³ Will Rogers put it best: "When you find yourself in a hole, stop digging."
While many cite John Maynard Keynes as favoring government spending during a recession, he never intended to create structural deficits. He recommended that government should serve as a shock absorber for economic ups and downs. He prescribed surpluses in the best of times, with the proceeds serving to fund deficits in the bad times, supplemented by temporary borrowings if necessary. And he loathed inflation and currency debasement, which he correctly viewed as the scourge of the middle class.
GDP provides a misleading picture and a false sense of security. Instead of revealing an economy that we all viscerally know is weaker than a decade ago, it suggests an economy that is within hailing distance of a new peak in prosperity for the average American. Top-line GDP has recovered handily from its lows, on the back of record debt-financed consumption. But, our Structural GDP and Private Sector GDP are both floundering. Focusing on top-line GDP tempts us all to rely on ever more debt-financed consumption, until our lenders say "no más."
The cardiac patient on the gurney has had his shot of adrenaline and is feeling better, but he is still gravely ill -- more so than before his latest heart attack -- as these two simple GDP measures amply demonstrate.
Endnotes
1 A "correct" measure would subtract all new debt that is backed only by future income, lacking collateral. Very little private debt lacks collateral, and very little public debt is backed by anything other than future income. So, for simplicity's sake in this article, we subtract only net new government debt. 2 Despite no change in tax rates since 2003, this situation is often blamed on the perfidy of the affluent, not the evaporation of capital gains, hence capital gains taxes. We should recognize that the enemy is not success, it is poverty. But, when we rue the latter, we too often blame the former. 3 See the November 2009 issue of Fundamentals, entitled "The '3-D' Hurricane Force Headwind," for more details on the daunting levels of off-balance-sheet debt. Our debt/GDP ratio may be poised to cross 100% of GDP this fall, but our GAAP accounting debt burden is already well past 400% of GDP and well past 500% of Structural GDP.
John F. Mauldin
johnmauldin@investorsinsight.com
John Mauldin, Best-Selling author and recognized financial expert, is also editor of the free Thoughts From the Frontline that goes to over 1 million readers each week. For more information on John or his FREE weekly economic letter go to: http://www.frontlinethoughts.com/learnmore
To subscribe to John Mauldin's E-Letter please click here:http://www.frontlinethoughts.com/subscribe.asp
Copyright 2011 John Mauldin. All Rights Reserved
Note: John Mauldin is the President of Millennium Wave Advisors, LLC (MWA), which is an investment advisory firm registered with multiple states. John Mauldin is a registered representative of Millennium Wave Securities, LLC, (MWS), an FINRA registered broker-dealer. MWS is also a Commodity Pool Operator (CPO) and a Commodity Trading Advisor (CTA) registered with the CFTC, as well as an Introducing Broker (IB). Millennium Wave Investments is a dba of MWA LLC and MWS LLC. Millennium Wave Investments cooperates in the consulting on and marketing of private investment offerings with other independent firms such as Altegris Investments; Absolute Return Partners, LLP; Plexus Asset Management; Fynn Capital; and Nicola Wealth Management. Funds recommended by Mauldin may pay a portion of their fees to these independent firms, who will share 1/3 of those fees with MWS and thus with Mauldin. Any views expressed herein are provided for information purposes only and should not be construed in any way as an offer, an endorsement, or inducement to invest with any CTA, fund, or program mentioned here or elsewhere. Before seeking any advisor's services or making an investment in a fund, investors must read and examine thoroughly the respective disclosure document or offering memorandum. Since these firms and Mauldin receive fees from the funds they recommend/market, they only recommend/market products with which they have been able to negotiate fee arrangements.
Opinions expressed in these reports may change without prior notice. John Mauldin and/or the staffs at Millennium Wave Advisors, LLC and InvestorsInsight Publishing, Inc. ("InvestorsInsight") may or may not have investments in any funds cited above.
Disclaimer PAST RESULTS ARE NOT INDICATIVE OF FUTURE RESULTS. THERE IS RISK OF LOSS AS WELL AS THE OPPORTUNITY FOR GAIN WHEN INVESTING IN MANAGED FUNDS. WHEN CONSIDERING ALTERNATIVE INVESTMENTS, INCLUDING HEDGE FUNDS, YOU SHOULD CONSIDER VARIOUS RISKS INCLUDING THE FACT THAT SOME PRODUCTS: OFTEN ENGAGE IN LEVERAGING AND OTHER SPECULATIVE INVESTMENT PRACTICES THAT MAY INCREASE THE RISK OF INVESTMENT LOSS, CAN BE ILLIQUID, ARE NOT REQUIRED TO PROVIDE PERIODIC PRICING OR VALUATION INFORMATION TO INVESTORS, MAY INVOLVE COMPLEX TAX STRUCTURES AND DELAYS IN DISTRIBUTING IMPORTANT TAX INFORMATION, ARE NOT SUBJECT TO THE SAME REGULATORY REQUIREMENTS AS MUTUAL FUNDS, OFTEN CHARGE HIGH FEES, AND IN MANY CASES THE UNDERLYING INVESTMENTS ARE NOT TRANSPARENT AND ARE KNOWN ONLY TO THE INVESTMENT MANAGER.
John Mauldin Archive |
© 2005-2022 http://www.MarketOracle.co.uk - The Market Oracle is a FREE Daily Financial Markets Analysis & Forecasting online publication.