


Stock Market Near Term Consolidation Has Begun
Stock-Markets / Stock Markets 2011 Jul 11, 2011 - 01:42 AM GMTBy: Andre_Gratian

 Very Long-term trend - The continuing strength in the indices is causing me to question whether we are in a secular bear market or two consecutive, cyclical bull/bear cycles. In any case, the very-long-term cycles are down and, if they make their lows when expected, there will be another steep and prolonged decline into 2014-16.
Long-term trend - In March 2009, the SPX began a move which evolved into a bull market. Cycles point to a continuation of this trend for several more months.
SPX: Intermediate trend - he intermediate correction which started in early May ended at 1258 and the uptrend has resumed. The base that was formed at the bottom of the correction carries a potential target in the 1400s.
Analysis of the short-term trend is done on a daily basis with the help of hourly charts. It is an important adjunct to the analysis of daily and weekly charts which discusses the course of longer market trends.
Market Overview
In the last letter, I stated that the market was overbought and a correction would start when the indices broke their very steep trend lines. The first trend line break came after the SPX reached its 1338 phase projection, but it only produced a sideways move of a couple of days. Then the SPX went on to meet its next phase projection of 1356 before correcting. In doing so, it created a very obvious exhaustion gap in the QQQ. On Friday morning, the gap was filled with a downside gap which, in turn was subsequently filled by a rally at the close.
Although some downside P&F targets and Fibonacci retracements were met in the first two hours of trading on Friday, it is unlikely that the rally which ensued marks the resumption of the uptrend. More correction is probably still before us, for a number or reasons:
-- From a structural standpoint, Friday's rally is probably the "b" wave of an a-b-c corrective pattern with the "c" wave still ahead. It has a couple of options: the SPX holds above 1331, creating a mild end to the correction before the uptrend resumes, or it breaks below 1331 thereby creating a H&S pattern followed by a drop in the low 1300s.
-- My view that the correction is not complete is supported by the hourly indicators which, in spite of the rally, have not given a buy signal.
-- The timing and extent of the "c" wave completion is not clear. There is a 9-mo cycle low due over the next two weeks which could affect the timing and prevent the SPX from resuming its uptrend until it has bottomed. If the H&S pattern is validated, it will give us a downside target.
-- The weekly indicator pattern of the SPX is still a bit of a concern. On Thursday, I said that it was now in an uptrend. That is true if only the price action is considered, but the indicators have yet to confirm the new uptrend, as we will see in the following chart.
-- The daily indicators have become overbought and are just now beginning to roll over. They will need time to correct.
Let's now move to the charts!
Chart Analysis
This is a composite of the SPX represented in three time frames: weekly, daily, and hourly. My bullish concern is with the weekly chart indicators (left). Although the price has given a buy signal by breaking a downtrend line and moving above the MAs, the bottom indicator (MSO) has only given a half-hearted one, and the MACD, although it is still positive and has turned up, will not give a confirmed buy signal until its lines have crossed, turning the histogram green. This suggests impending problems with the intermediate uptrend, but it does not tell us when they will manifest themselves. Probably not right away.
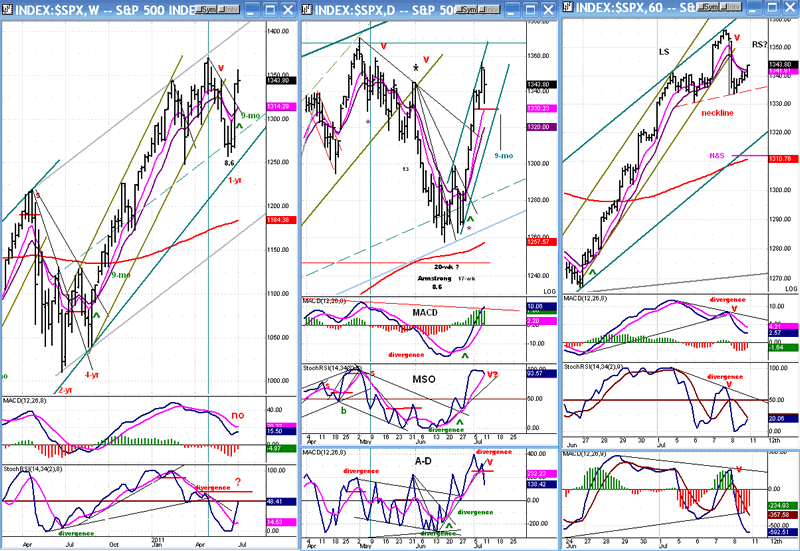
The daily chart is also giving bearish signals, but of a short-term nature. It has become overbought and, as signaled by the A/D indicator, has begun to correct. This indicator is always the first to warn of a potential reversal. The MSO is right behind, still overbought and beginning to roll over, with its lines about to cross. The MACD will be the last. If the correction is short-lived, it will just flatten out, but if it lasts a few days, it will turn down.
The hourly chart is the most convincing of the three that a correction has started to take place and that it is not finished. It would be highly unusual for an uptrend to start with two of the indicator still in a downtrend, and with the third having barely turned up and still below its downtrend line.
The top formation looks like an incomplete Head & Shoulders pattern which will become complete if the "c" wave trades below 1331. If that level holds, and the correction is completed above it, the H&S pattern will, once again, become invalidated. If it does turn out to be real, the correction should end in the vicinity of the 200-hr MA -- just above 1310.
Point & figure projections
More often than not, the extent of a consolidation - as measured on a P&F chart - gives an accurate projection of the next market move. This consolidation can usually be divided into phases which also forecast fairly accurately where the index will pause on its way to the final destination.
The entire base that was built by the SPX during its latest correction has a maximum projection in the 1400s. This is the target that we should consider in our analysis of the current trend. However, it is often the case that the maximum projection is not reached, because one of the phase counts turns out to be the top of the move. This is where the technical indicators come in. If they give some indication of a top just as a phase target is reached, it should not be ignored.
Cycles
After this intermediate uptrend is over, the market will probably decline into October (the 3-yr cycle low).
For now, the 9-mo cycle (which is due in the middle of the month) could be responsible for the current correction. Ideally, its low should come on 7/18, but that date may not be strictly observed and the cycle will probably make its low when the downside target has been reached, and when the indicators tell us that the correction is over.
Breadth
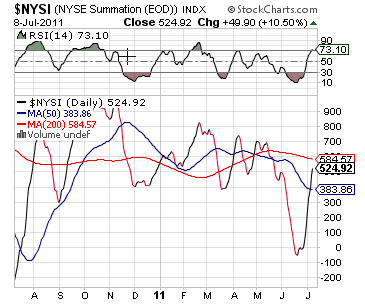
In the past week, the pattern of the NYSE Summation Index (courtesy of StockCharts.com) has improved measurably, although it has not yet made it up to its previous top. But then, neither has the SPX. If the market makes new highs, but the NYSI does not, it will constitute intermediate negative divergence and will be a warning that the intermediate trend is ending. This will most likely be confirmed by the SPX weekly oscillators. Let's watch the RSI to see when it becomes overbought.
Sentiment
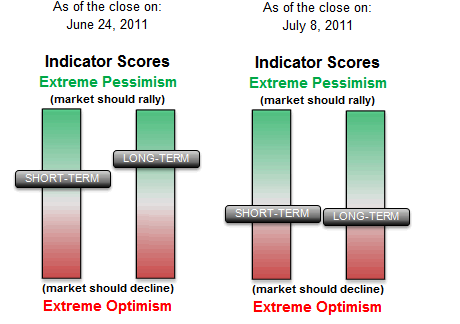
The SentimenTrader (courtesy of same) has lost a great deal of its bullishness, and has even entered negative territory, but it is a long way from suggesting that a market top has arrived.
The index to watch is the long-term index. The short-term index has not proven to be very reliable. A week ago, the short-term reading was as negative as it could possibly get, and yet, the market's response was only to go sideways for a couple of days before resuming its uptrend. Since all the other indicators had also been very overbought, everything had indicated more of a pull-back.
I have kept in place the reading of two weeks ago so that you can see how today's index compares to it. The long-term index is now in the red zone, but if it repeats its normal historical pattern, it will have to get far more negative to call for an end to the uptrend.
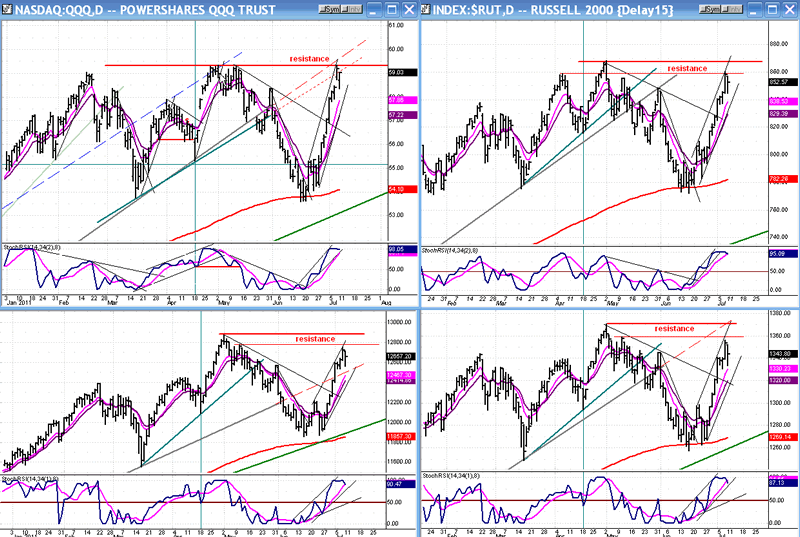
Two indices which normally lead the market are the QQQ & RUT. On the next chart composite, we will analyze how they compare in performance with the DJIA (bottom left) and the SPX (bottom right). It is clear that the QQQ is living up to its reputation. It is visibly stronger than the rest, having recorded a fractional new high last week. The RUT is slightly stronger than the DJIA and SPX on the short-term, but it appears to be leading on the long-term since it bottomed farther away from its long-term (green) trend line than the other three.
We also see that the QQQ is now encountering a zone of resistance which looks more severe than the other indices -- something that may turn out to be a near-term problem for this index.
If you look at the comparable trend lines on all four indices, you can see that they all have individual profiles and that it is not possible to make an exact comparison between the four, but they do have a unifying factor: their MSO indicator looks pretty much alike for all of them. It is overbought and beginning to roll over. And we need to remember that the A/D indicators of both the NYSE and NASDAQ have already given a sell signal.
From these observations and what has been said earlier, we could conclude that an extension of the near-term correction is likely but, until there is visible negative divergence between the QQQ and the other indices, the longer-term trend remains intact.
The fact that the SPX is lagging can be attributed to the weakness of the financial index, which is certainly one of the most important leading indices. Its very poor performance is something that should not go unnoticed in the total market perspective.
Summary
The analyst's greatest challenge is to find indicators that accurately and consistently represent the market position, and he must analyze them objectively. The only conclusion that I can draw after the extensive analysis that I have presented above, is that a near-term consolidation has begun. Its extent in price will depend on whether or not it can be contained above the SPX 1331 level, and the time factor could be influenced by the 9-mo cycle.
Having said that, no matter how clear the technical picture may appear, it is never an absolute and there is always a degree of uncertainty. A sudden news report which contradicts the technicals can happen at any time. However, that would be the exception. The great majority of the time, the technical condition gives an accurate preview of the market behavior.
FREE TRIAL SUBSCRIPTON
If precision in market timing for all time frames is something which is important to you, you should consider a trial subscription to my service. It is free, and you will have four weeks to evaluate its worth.
For a FREE 4-week trial. Send an email to: ajg@cybertrails.com
For further subscription options, payment plans, and for important general information, I encourage you to visit my website at www.marketurningpoints.com. It contains summaries of my background, my investment and trading strategies and my unique method of intra-day communication with Market Turning Points subscribers.
By Andre Gratian
MarketTurningPoints.com
A market advisory service should be evaluated on the basis of its forecasting accuracy and cost. At $25.00 per month, this service is probably the best all-around value. Two areas of analysis that are unmatched anywhere else -- cycles (from 2.5-wk to 18-years and longer) and accurate, coordinated Point & Figure and Fibonacci projections -- are combined with other methodologies to bring you weekly reports and frequent daily updates.
“By the Law of Periodical Repetition, everything which has happened once must happen again, and again, and again -- and not capriciously, but at regular periods, and each thing in its own period, not another’s, and each obeying its own law … The same Nature which delights in periodical repetition in the sky is the Nature which orders the affairs of the earth. Let us not underrate the value of that hint.” -- Mark Twain
You may also want to visit the Market Turning Points website to familiarize yourself with my philosophy and strategy.www.marketurningpoints.com
Disclaimer - The above comments about the financial markets are based purely on what I consider to be sound technical analysis principles uncompromised by fundamental considerations. They represent my own opinion and are not meant to be construed as trading or investment advice, but are offered as an analytical point of view which might be of interest to those who follow stock market cycles and technical analysis.
Andre Gratian Archive |
© 2005-2022 http://www.MarketOracle.co.uk - The Market Oracle is a FREE Daily Financial Markets Analysis & Forecasting online publication.