


How to Find and "Hook" Potential Trade Setups
InvestorEducation / Learn to Trade Jul 12, 2011 - 12:14 PM GMTBy: EWI

 Trading using technical indicators -- such as the MACD, for example, Moving Average Convergence-Divergence -- can do one of two things: help you or hinder you.
Using them as a forecasting method alone can be about as predictable as flipping a coin. But when you combine them with other forms of technical analysis (i.e. the Wave Principle), the same MACD can be your new best friend.
Technical indicators are meant to do exactly what the name implies: "indicate" that a buy or sell signal may be in place. (Don't confuse "indicate" with "guarantee": They are not called "technical guarantors" for a reason.)
Elliott Wave International's Futures Junctures editor Jeffrey Kennedy shows you how he uses technical indicators to his advantage in his FREE eBook, The Commodity Trader's Classroom:
"Rather than using technical indicators as a means to gauge momentum or pick tops and bottoms, I use them to identify potential trade setups."
Jeffrey goes on to describe his favorite indicator, the MACD:
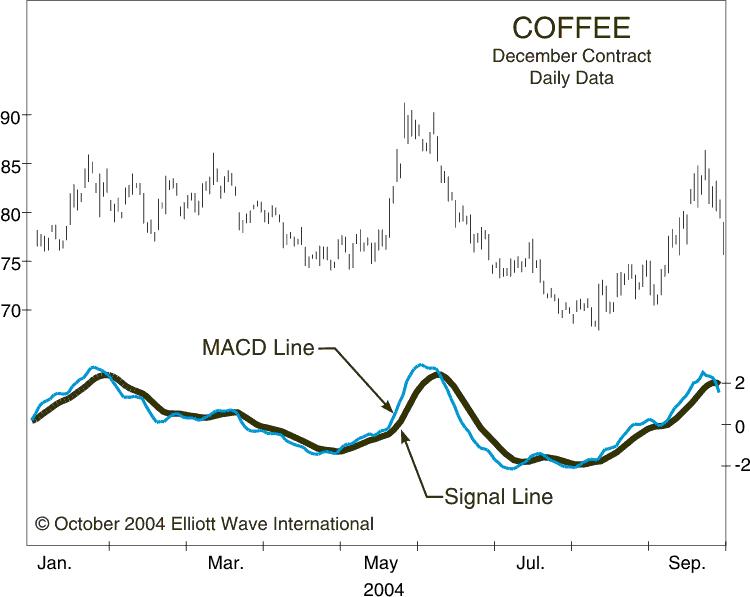
"Out of the hundreds of technical indicators I have worked with over the years, my favorite study is the MACD [which] uses two exponential moving averages (12-period and 26-period). The difference between these two moving averages is the MACD line. The trigger or Signal line is a 9-period exponential moving average of the MACD line."
Figure 10-1 gives you an example of the MACD indicator in Coffee futures.
One of the signals of a potential trade setup that the MACD often introduces is what Jeffrey refers to as the Hook. Here's another quote from the free eBook:
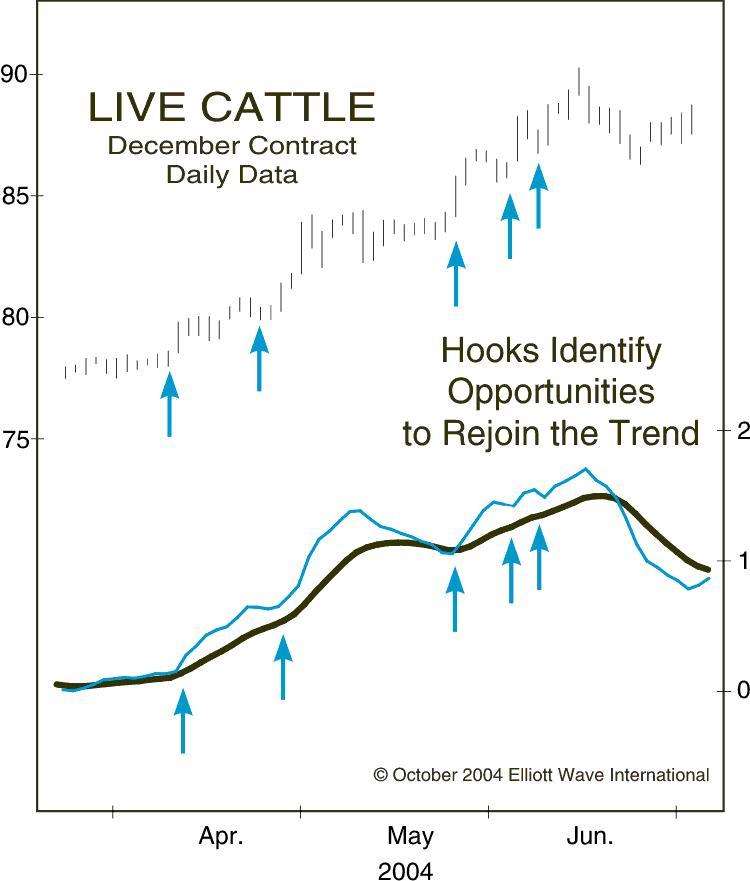
"A Hook occurs when the MACD line penetrates, or attempts to penetrate, the Signal line and then reverses at the last moment. In addition to identifying potential trade setups, you can also use Hooks as confirmation. Rather than entering a position on a cross-over between the MACD line and Signal line, wait for a Hook to occur to provide confirmation that a trend change has indeed occurred. Doing so increases your confidence in the signal, because now you have two pieces of information in agreement."
Figure 10-4 gives you an example of the Hook at work in live cattle futures.
"A Hook should really just be a big red flag, saying that the larger trend may be ready to resume. It’s not a trading system that I follow blindly. All I'm looking for is a heads-up that the larger trend is possibly resuming."
 |
Learn more about other technical indicators that you can use to your advantage, as well as the other important lessons in the FREE 32-page eBook, The Commodity Trader's Classroom. It is filled with actionable lessons you can apply to your trading strategy. Download it right now, instantly, when you create your free Club EWI profile. |
This article was syndicated by Elliott Wave International and was originally published under the headline How to Find and "Hook" Potential Trade Setups. EWI is the world's largest market forecasting firm. Its staff of full-time analysts led by Chartered Market Technician Robert Prechter provides 24-hour-a-day market analysis to institutional and private investors around the world.
About the Publisher, Elliott Wave International
Founded in 1979 by Robert R. Prechter Jr., Elliott Wave International (EWI) is the world's largest market forecasting firm. Its staff of full-time analysts provides 24-hour-a-day market analysis to institutional and private around the world.
© 2005-2022 http://www.MarketOracle.co.uk - The Market Oracle is a FREE Daily Financial Markets Analysis & Forecasting online publication.