


Stock Market Inflection Point Continues
Stock-Markets / Stock Markets 2011 Jul 18, 2011 - 11:14 AM GMTBy: Tony_Caldaro

 After two weeks of solid gains the market opened the week facing a major selloff in the overnight futures market. Fears arose in Europe that Italy could be facing another debt crisis. Since the market had just gone through another Greece bailout, the uncertainty of the another debt crisis in the PIIGS, (Portugal, Ireland, Italy, Greece and Spain), drove European and some Asian markets sharply lower. International markets recovered somewhat during the week but ended solidly in the red. Economic reports for the week were mixed. On the negative side: the trade balance worsened, import prices declined, the CPI/PPI turned negative, consumer sentiment dropped sharply, and the NY FED remained in the red.
On the positive side: the budget deficit improved, as did, weekly jobless claims, retail sales, business inventories, and industrial production. Excess reserves and the monetary base hit a new high. Export prices, capacity utilization and the WLEI were flat to unchanged. As for the markets. The SPX/DOW were -1.8%, and the NDX/NAZ were -2.3%. Asian markets lost 2.0%, European markets lost 3.4%, the Commodity equity group slid 1.6%, and the DJ World index lost 2.3%. Next week we get updates on Housing, the Leading indicators and the Philly FED.
LONG TERM: bull market at inflection point
During the week we published two special reports. The first one was on tuesday: http://caldaro.wordpress.com.../. In this report we discussed the continuing weakness in several foreign markets. Then on thursday: http://caldaro.wordpress.com/... In this report we discussed bull and bear market potentialities. In this weekend report we will provide an update on both.
After the close friday we reviewed all 15 of the various country indices we track using a spread sheet. In short, the situation as worsened. Switzerland’s SMI can now be added to the list of ongoing bear markets. Japan’s NIKK, Spain’s IBEX and China’s SSEC, (potentially bottoming), are the others. Brazil’s BVSP is quite close to confirming a bear market, and the India BSE bull market has been quite sloppy with many overlapping waves. The other nine indices all have potential five waves up into the recent highs, or five waves up into 2010 then a three wave, thus far, ABC rally. The only exception is Russia’s RTSI, which continues to impulse higher. This is not what should be occurring at this stage of a worldwide bull market. Unless, of course, this fragmentation is displaying a deterioration in worldwide investor bullish sentiment and is a precursor of things to come. You can review all these charts with this link: http://stockcharts.com/...
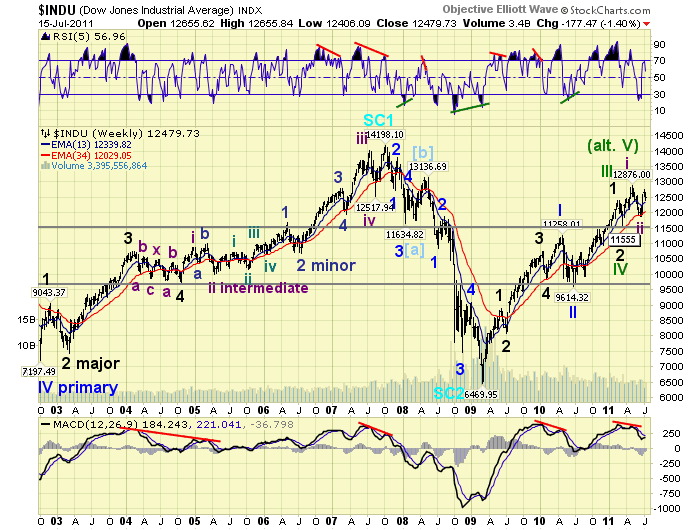
In the second report; “Inflection point” we posted a potential five waves up into the May 2011 DOW 12,876 high, and drew the proverbial line in the sand at DOW 11,555. A decline below that level would completely retrace the previous and current uptrend, and substantially increase the probability of the alternate count: the bull market has completed. While we are waiting for this potential event, we reviewed some technical indicators that have a fairly good record of signalling internal deterioration after a potential bull market fives waves up and internal strength after a potential bear market three waves down. In short, many of them display negative divergences after the recent bull market highs.
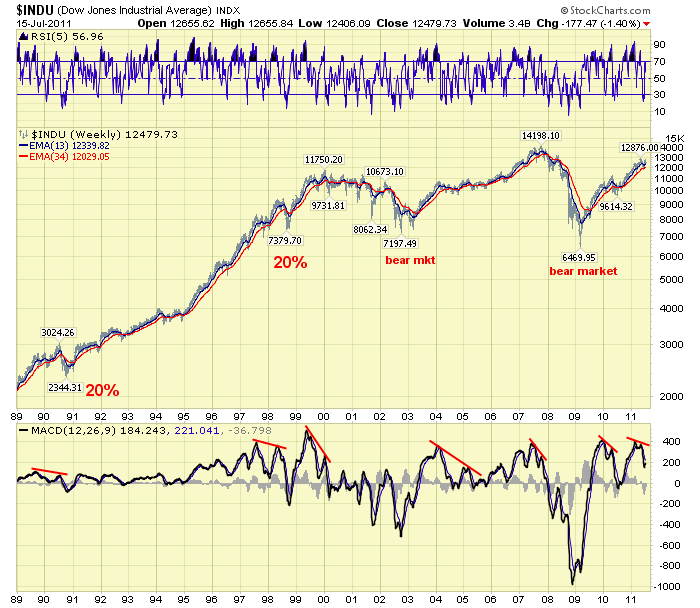
For example, the Banking (BKX) and Housing (HGX) sectors both topped in 2010 and have failed to make higher highs in 2011 despite a set of higher SPX/DOW highs (February and May) in 2011. This type of negative divergence is economic and it coincided with the 2000 and 2007 bull market highs. Pronounced negative divergences also appear in the weekly number of stocks above their 200 day moving average at the recent highs, in both the DOW/NDX. This is a technical negative. Another technical negative is the set of negative divergences in the weekly MACD. When one appears it usually leads to a steep correction (1990, 1998 and 2010) or a period of price stagnation (2005). When a set appears, after a potential five waves up, it usually leads to a bear market.
Another indicator displaying a negative divergence at the recent high is the performance of stocks verses bonds. Bond prices should not outperform stock prices as the stock market is making new highs. When they do it is a sign of economic trouble. This type of negative divergence also occurred at the 2000 and 2007 bull market highs. This last observation is not a technical indicator, simply an observation of the chart pattern of one of the major market leaders.
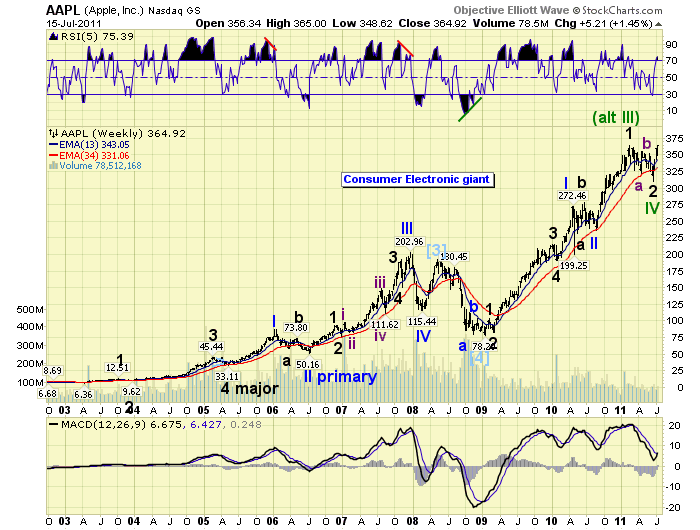
When we review AAPL’s chart, which closed at a new all time high on friday ($365), we can also count a potential five waves up from its early 2009 low ($78). We posted the count, in green, on its weekly chart.
There are still some positive signs remaining. The NYAD (market breadth) confirmed the new highs recently. As did the valuation XVG (value line index). The DOW Theory Transports confirmed the new highs as well. Plus, OEW still has the US market in a quantified long term uptrend (bull market) and medium term uptrend. Should the current uptrend resume to higher highs, and the indicators with negative divergences clear, the inflection point would have been resolved for a continuation of the bull market. If not, we may have ready seen the bull market high in early May. Until the situation gets resolved a defensive position is warranted.
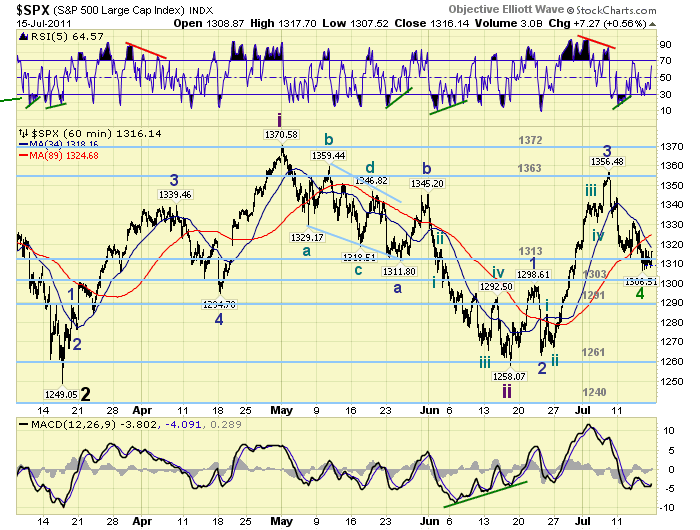
MEDIUM TERM: uptrend high SPX 1356
The current uptrend started in June at SPX 1258 and has risen up in three waves, thus far: SPX 1299, 1263 and 1356. This week’s decline to SPX 1307 was far more than expected, but still within the parameters of a 4th wave during a five wave uptrend. The important OEW 1313 pivot range held support for the entire week despite the ongoing European debt problems, the threat of an S&P downgrade on US debt, (surprised they still matter after 2008), the US debt ceiling impasse, and chairman Bernanke stating the FED has no current plans for expanding quantitative easing.
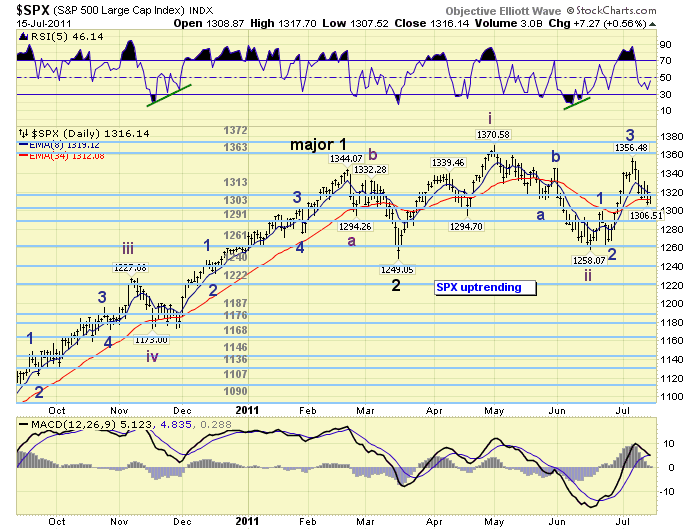
Our ongoing bullish count suggests the market is in Minor wave 4 (short term) of Intermediate wave iii (medium term) of Major wave 3 and Primary III (long term). Should the market hold support at the 1313 pivot and then rally above SPX 1356 it’s probably in Minor wave 5 of the current uptrend and headed to 1440. The market will likely need some sort of fundamental catalyst (good economic news) to allow this scenario to unfold.
Our alternate count, which is definitely increasing in probability, suggests the bull market ended at SPX 1371 in May 2011. We can count five Primary waves up from the March 2009 SPX 667 low: 1220, 1011, 1344, 1249 and 1371. Notice, Primary I (1220) and the potential Primary IV (1249) did not overlap. Without an overlap we can not be absolutely certain these latter waves, (from SPX 1011), are subdivisions of Primary III.
Technically, the weekly MACD remains above neutral (a positive), yet the RSI hit an uncharacteristically (for a bull market) oversold level during the last correction (a negative). The daily RSI is sufficiently oversold for a Minor wave 4 (a positive), and the MACD is holding its trendline (also a positive). With so many negative technicals, and the recent sharp pullback, this market needs to start rallying soon to avoid a potential breakdown.
SHORT TERM
Support for the SPX is at 1313 and then 1303, with resistance at 1363 and then 1372. Short term momentum touched slightly oversold and then rallied after the recent lows. The short term OEW charts remain negatively biased until the SPX can rally above 1320. During the week the rally above SPX 1330, which turned the charts positive, was quickly met with selling. Except for monday’s opening print SPX 1331 was the high for the week. There is short term overhead resistance at SPX 1318, 1327, 1331 and 1344 before we hit the 1356 uptrend high and OEW 1363 pivot range. On the downside there is short term support at SPX 1307, 1302, 1299 and then the OEW 1291 pivot range. As you can see there is not much room on the downside before we get an overlap of the potential Minor waves 1 and 4 of this uptrend. The upcoming week, which includes Senate testimony by FED chairman Bernanke on the Dodd-Frank Act, could be telling.
FOREIGN MARKETS
Asian markets were mostly lower on the week for a net loss of 2.0%. Three of the five indices we track remain in uptrends. Australia and Hong Kong are not.
European markets were all lower on the week losing 3.4%. Three of the five indices here are now in confirmed downtrends. England and Germany are not.
The Commodity equity group were all lower on the week for a net loss of 1.6%. Only one of the three is in a confirmed uptrend, Russia. Brazil and Canada are not.
The DJ World index is uptrending but lost 2.3% on the week.
COMMODITIES
Bond prices gained 1.0% on the week and are close to confirming another uptrend. Yields on the 10YR have dropped below 3% again, plus the 1YR (0.15%) and 3mth (0.05%) bills are at all time lows again.
Crude appears to be uptrending gaining 1.1% on the week, all of that on friday. The potential uptrend is not confirmed yet.
Gold (+3.2%) is uptrending again after a surprisingly mild Major wave 4 three wave correction. The Major wave 4 in Silver (also uptrending) was more in line with expectations.
USD is uptrending and dipped 0.1% on the week. The downtrending EUR lost 0.7%, yet the uptrending JPY gained 1.8% on the week.
NEXT WEEK
A generally quiet economic week starts with the NAHB housing index at 10:00 on monday. On tuesday Housing starts and Building permits. Wednesday Existing home sales. Then thursday, weekly Jobless claims, the Philly FED, Leading indicators and the FHFA housing index round out the week. FED chairman Bernanke gives Senate testimony on thursday. Best to you and yours this weekend. Also remember, after a 100% gain in the US stock market in just two years defensive posturing is now warranted.
CHARTS: http://stockcharts.com/...
http://caldaroew.spaces.live.com
After about 40 years of investing in the markets one learns that the markets are constantly changing, not only in price, but in what drives the markets. In the 1960s, the Nifty Fifty were the leaders of the stock market. In the 1970s, stock selection using Technical Analysis was important, as the market stayed with a trading range for the entire decade. In the 1980s, the market finally broke out of it doldrums, as the DOW broke through 1100 in 1982, and launched the greatest bull market on record.
Sharing is an important aspect of a life. Over 100 people have joined our group, from all walks of life, covering twenty three countries across the globe. It's been the most fun I have ever had in the market. Sharing uncommon knowledge, with investors. In hope of aiding them in finding their financial independence.
Copyright © 2011 Tony Caldaro - All Rights Reserved Disclaimer: The above is a matter of opinion provided for general information purposes only and is not intended as investment advice. Information and analysis above are derived from sources and utilising methods believed to be reliable, but we cannot accept responsibility for any losses you may incur as a result of this analysis. Individuals should consult with their personal financial advisors.
© 2005-2022 http://www.MarketOracle.co.uk - The Market Oracle is a FREE Daily Financial Markets Analysis & Forecasting online publication.