


Sales of Existing U.S. Homes Fall, Partly Due to Cancellations
Housing-Market / US Housing Jul 20, 2011 - 03:53 PM GMTBy: Asha_Bangalore

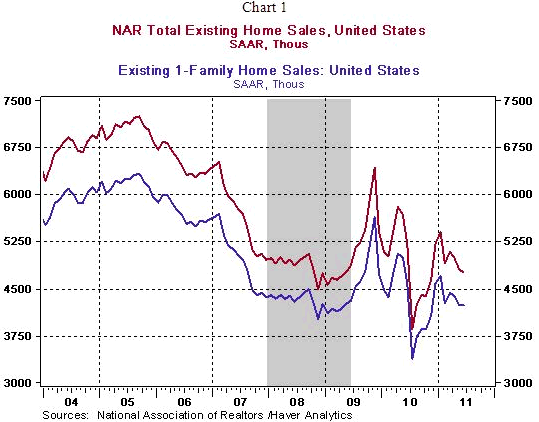
 Sales of existing homes declined 0.8% to an annual rate of 4.77 million units in June. The cycle low for sales of existing homes, excluding the swings related to the first-time home buyer credit program, is 4.5 million units, recorded in November 2008. Effectively, sales of existing homes have risen 6.0% from the cycle low mark (see Chart 1). Sales of single-family homes held steady at 4.24 million in June, up 5.5% from the cycle low reading of 4.02 million in November 2008.
The peak for sales of single-family homes occurred in September 2005 (6.34 million units). Sales of existing homes fell in the Northeast (-5.2%) and West (-1.7%) but rose in the Midwest (+1.0%) and South (+0.5%). The National Association of Realtors has indicated that 16% of realtors reported sales cancellations in June vs. 4% in May. The reasons for cancellations are unclear, with appraisals and tightness of credit being cited as possibilities.
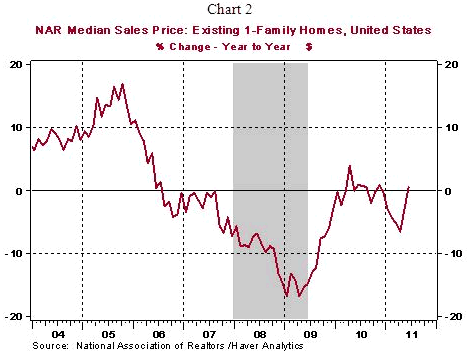
The median price of an existing single-family home stood at $184,600 in June up 8.7% from the month and 0.6% higher from a year ago. The year-to-year increase is the first since November 2010 (see Chart 2). This improvement in pricing of existing homes is encouraging and additional such gains would suggest that housing market conditions are stabilizing. However, this optimism may have to be revised in light of the large number of unsold existing single-family homes and persistence of distressed properties in the market place.
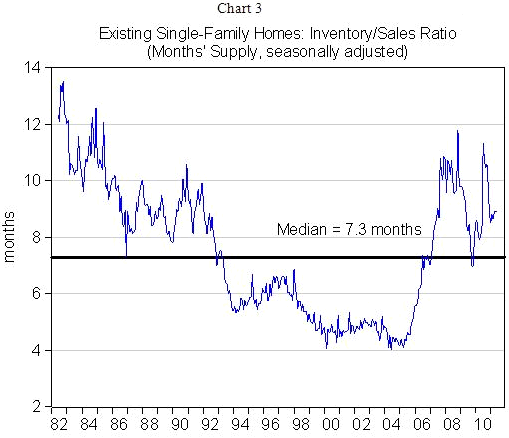
Inventories of unsold single-family existing homes have held at 8.9 months supply in each of the three months of the second quarter, up from 8.6-month mark in March.
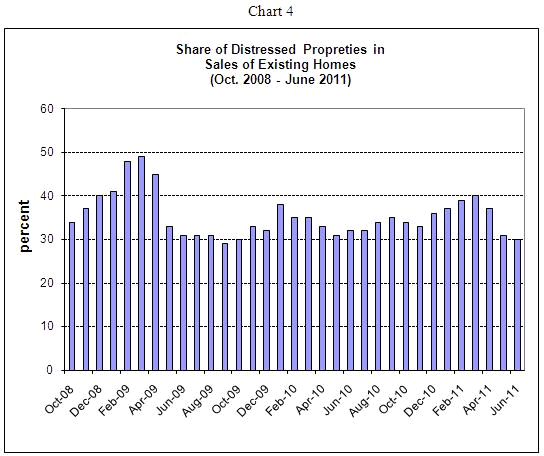
In June, 30% of existing homes sold were distressed properties according to the National Association of Realtors, which is a nearly steady reading compared with 31% in May 2011 and 32% in June 2010. Chart 4 indicates that distressed properties sold continue to hold at an elevated level, which plays an important role in pricing of existing homes. The good news is that the share of distressed properties in sales of existing homes shows a small declining trend since February 2011 (see Chart 4) and the June reading (30%) is below the median (34%) for the period October 2008-June 2011.
Asha Bangalore — Senior Vice President and Economist
http://www.northerntrust.com
Asha Bangalore is Vice President and Economist at The Northern Trust Company, Chicago. Prior to joining the bank in 1994, she was Consultant to savings and loan institutions and commercial banks at Financial & Economic Strategies Corporation, Chicago.
Copyright © 2011 Asha Bangalore
The opinions expressed herein are those of the author and do not necessarily represent the views of The Northern Trust Company. The Northern Trust Company does not warrant the accuracy or completeness of information contained herein, such information is subject to change and is not intended to influence your investment decisions.
© 2005-2022 http://www.MarketOracle.co.uk - The Market Oracle is a FREE Daily Financial Markets Analysis & Forecasting online publication.