


40 Years of Fiat Currency, Is Gold as ‘Cheap’ as it was in 1971?
Commodities / Gold and Silver 2011 Aug 17, 2011 - 11:52 AM GMTBy: Aftab_Singh

 Monday was the 40th anniversary of the irredeemable fiat dollar. Unlike the preceding 39 anniversaries, this one was actually noticed! Here, I present several charts that show the changes to the Fed’s balance sheet since 1971. I conclude that the current gold price may be as ‘cheap’ as it was in 1971!
To review what happened just over 40 years ago, I quote from Murray Rothbard’s fantastic little book, ‘What Has Government Done to Our Money?‘:
On August 15, 1971, at the same time that President Nixon imposed a price-wage freeze in a vain attempt to check bounding inflation, Mr. Nixon also brought the post-war Bretton Woods system to a crashing end. As European Central Banks at last threatened to redeem much of their swollen stock of dollars for gold, President Nixon went totally off gold. For the first time in American history, the dollar was totally fiat, totally without backing in gold. Even the tenuous link with gold maintained since 1933 was now severed. The world was plunged into the fiat system of the thirties—and worse, since now even the dollar was no longer linked to gold. Ahead loomed the dread spectre of currency blocs, competing devaluations, economic warfare, and the breakdown of international trade and investment, with the worldwide depression that would then ensue.
For anyone who’s interested, here’s the video of Nixon’s announcement:
The Charts:
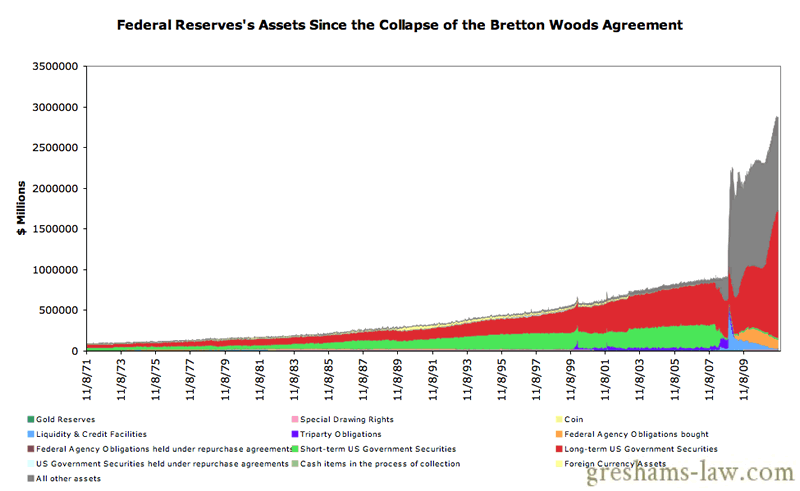
Federal Reserve's Assets Since the Collapse of the Bretton Woods Agreement Source: St Louis Fed
As can be seen on the chart above, the Fed’s assets have exploded since the collapse of the Bretton Woods agreement. Until 2007, the expansion was mainly in favor of US government securities. The period from 2007 to 2010 brought about a large increase in the quantity of ‘other assets’ (mainly Mortgage-backed Securities and other junk). With the most recent quantitative easing program (QE2), the Fed’s assets are reverting back in favor of Long-term US Government Securities.
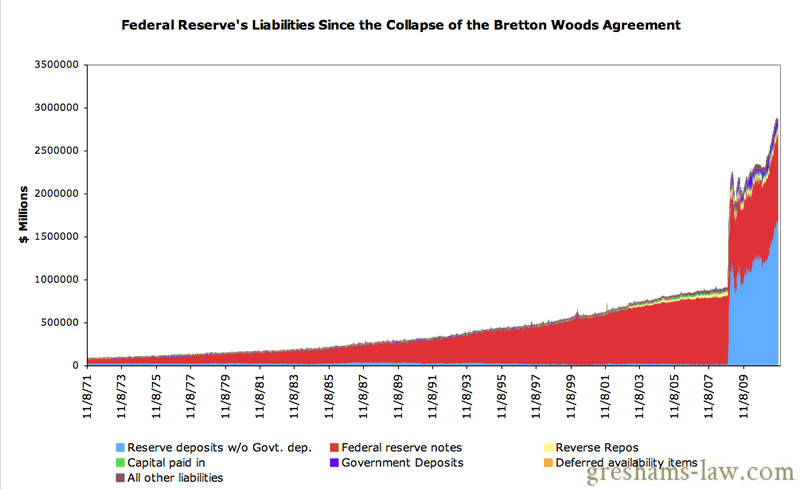
Federal Reserve's Liabilities Since the Collapse of the Bretton Woods Agreement. Source: St Louis Fed
Of course, we can see precisely the same explosion in the Fed’s liabilities. Until 2007, this expansion was largely in favor of Federal Reserve Notes. Since 2007, the increase in the Fed’s liabilities has been in favor of Reserve Deposits. This was the real bailout of the banks. If one takes a moment to contemplate this, one realizes that all dollar holders (Worldwide!) took an enormous implicit haircut to preserve the status quo of the American Banking System!!!
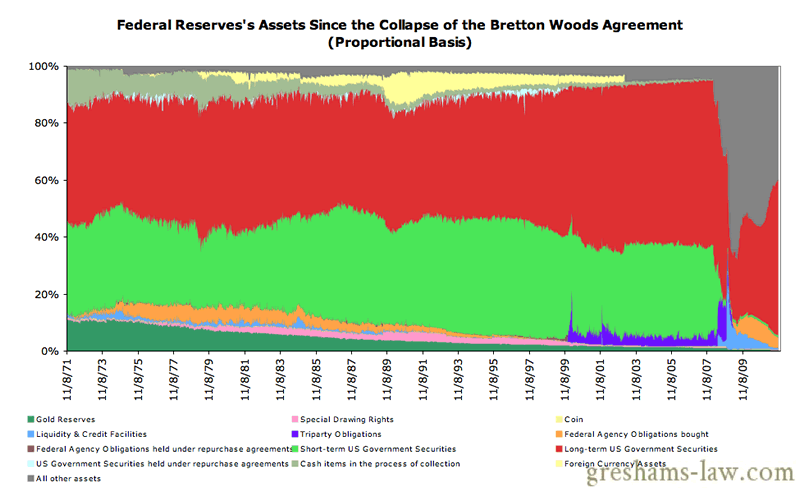
Federal Reserve's Assets Since the Collapse of the Bretton Woods Agreement (Proportional Basis) . Source: St Louis Fed
The chart above shows the Fed’s assets on a proportional basis. ‘Gold Reserves’ as a proportion of the total balance sheet have been declining ever since the collapse of the Bretton Woods Agreement. Currently, ‘Gold Reserves’ seem negligible (this is partly due to the Fed’s funky accounting). It is clear that there have been some periods where large changes were made to the composition of the Fed’s assets, however it is equally clear that such changes pale in comparison to the drastic alterations seen over the past 3-5 years.
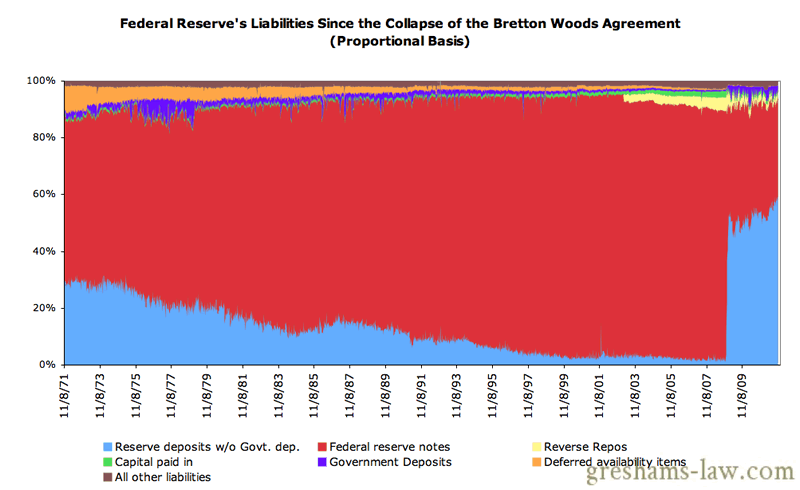
Federal Reserve's Liabilities Since the Collapse of the Bretton Woods Agreement (Proportional Basis) . Source: St Louis Fed
Again, the sheer size of the bank bailout is evident from the chart above. After declining proportionally for 35 years, ‘Reserve Deposits’ exploded in 2007/2008. The declining proportion of ‘Reserve deposits’ shows the progressively greater doses of leverage used in the American banking system. The recent explosion in ‘Reserve deposits’ demonstrates the enormity of the bailout! The low in the light blue portion on the chart above was the peak in excitement about banking. The current peak represents the banking industry’s march towards boredom.
[NOTE: The following charts are available on the 'Long-Term Charts' page (where they go back to 1915). They are updated every week.]
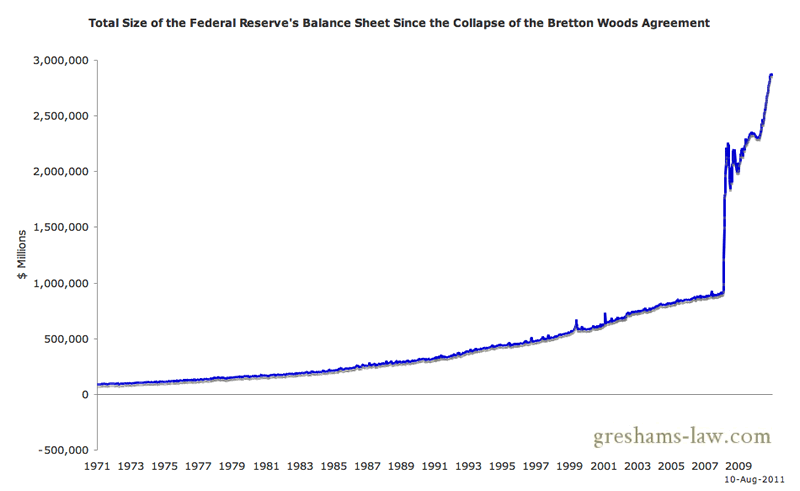
Total Size of the Federal Reserve's Balance Sheet Since the Collapse of the Bretton Woods Agreement - Click to enlarge. Source: St Louis Fed
Since August 11, 1971, the Federal Reserve’s total balance sheet size has expanded from $88’711 million to $2’876’236 million (over 32 times!).
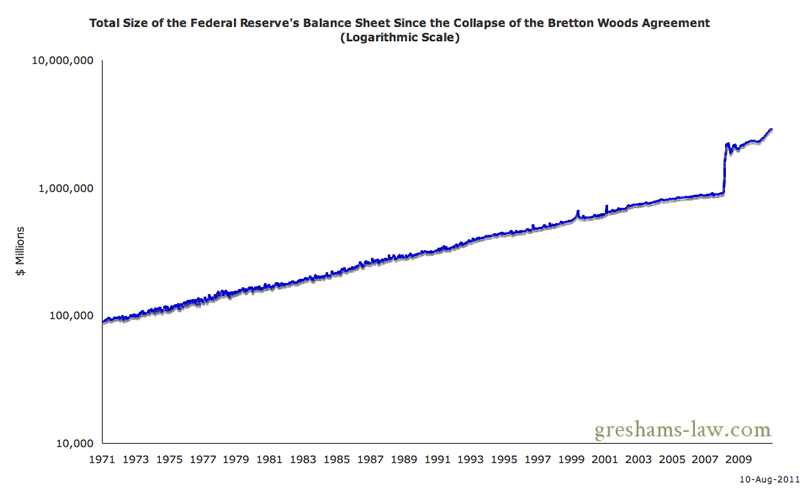
Total Size of the Federal Reserve's Balance Sheet Since the Collapse of the Bretton Woods Agreement (Log Scale) - Click to enlarge. Source: St Louis Fed
Same data on a logarithmic scale.
Market 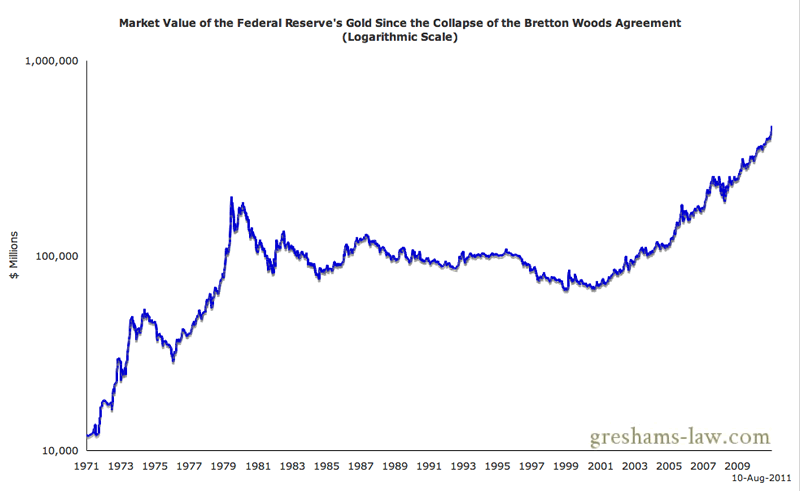 Value of the Federal Reserve's Gold Since the Collapse of the Bretton Woods Agreement - Click to enlarge. Source: St Louis Fed
Since August 11, 1971, the market value of the Federal Reserve’s gold has increased from $12’050 million to $463’229 million.
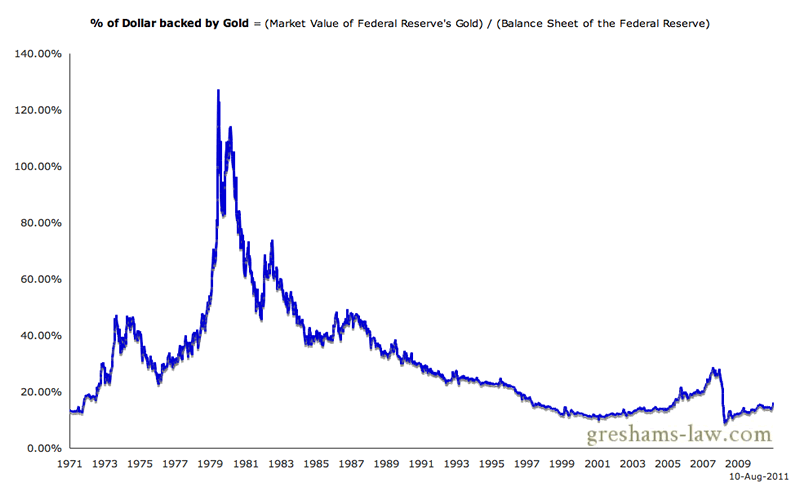
Gold Covering or Backing the Gold Since the Collapse of the Bretton Woods Agreement - Click to enlarge. Source: St Louis Fed
Using the data just mentioned above, we might conclude that the ‘degree to which the dollar is backed by gold’ (at market prices) hasn’t changed very much. On August 11, 1971, the dollar was 13.6% ’backed by gold’ and now the dollar is 16.1% ‘backed by gold’! This begs the rather startling question; is gold roughly as cheap as it was in 1971? Was the early part of the mid-20th century gold bull market covered up by the semantics of governmental meddling with money?
Aftab Singh is an independent analyst. He writes about markets & political economy at http://greshams-law.com .
© 2011 Copyright Aftab Singh - All Rights Reserved
Disclaimer: The above is a matter of opinion provided for general information purposes only and is not intended as investment advice. Information and analysis above are derived from sources and utilising methods believed to be reliable, but we cannot accept responsibility for any losses you may incur as a result of this analysis. Individuals should consult with their personal financial advisors.
© 2005-2022 http://www.MarketOracle.co.uk - The Market Oracle is a FREE Daily Financial Markets Analysis & Forecasting online publication.