


Financial Markets Outook for Gold, Stocks, Volatility, Euro and Bonds
Stock-Markets / Financial Markets 2011 Aug 23, 2011 - 04:19 AM GMTBy: Willem_Weytjens

 One month ago, the SP500 was trading at 1,345 points. Today it is trading at 1,128 points, or down over 16%.
One month ago, Gold was trading at $1,601. Today, it is trading at $1,891, or up over 18%.
We therefore look back at some historical developments in this report, in order to forecast future developments.
Let’s start with the SP500.
The SP500 retraced 38.20% of the rally from 2009 to 2011. The 50% Retracement level is often tested. This means we could see 1,020 on the SP500 over the next couple of weeks/months, where the market should find support.
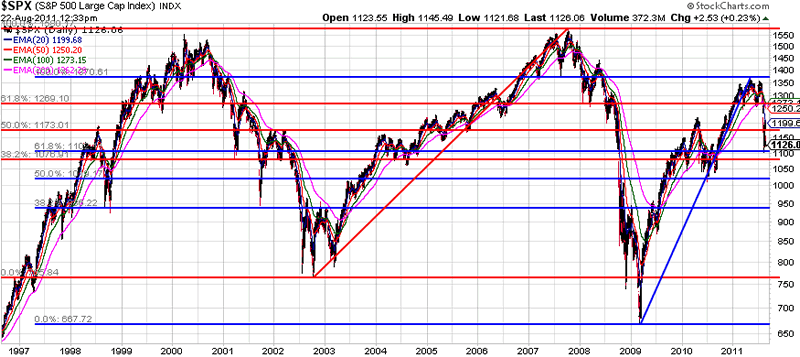
Chart courtesy Stockcharts.com
However, nothing goes up or down in a straight line. After huge sell offs, we often see strong rallies.
The RSI was very oversold recently but has worked itself out of this oversold position over the last couple of days.
A lower low for the SP500 will likely be accompanied by a higher low for the RSI, causing positive divergence.
That’s a time you would want to buy stocks.

Chart courtesy Stockcharts.com
In fact, when we look back at the last 20 years or so, the markets often set strong bottoms when the RSI fell this low:
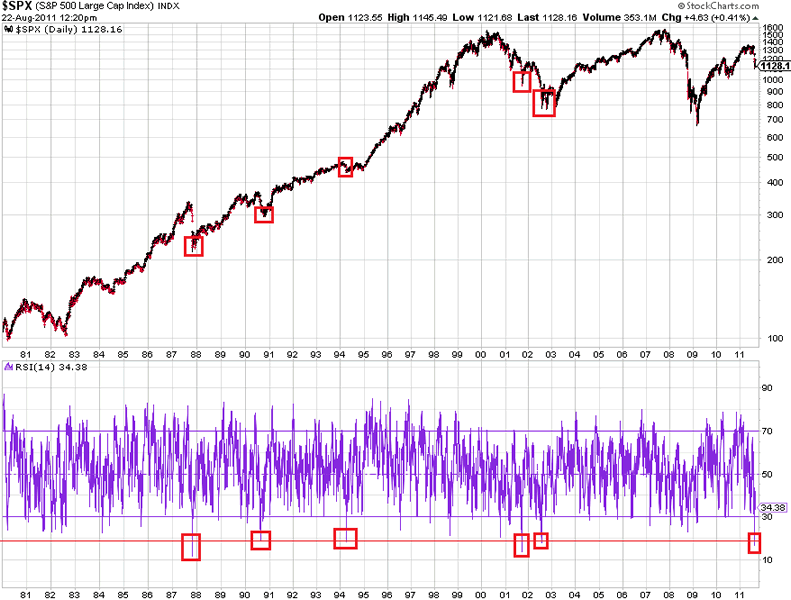
Chart courtesy Stockcharts.com
Will this time be different?
Let’s look at Volatility.
When the VIX-index climbed towards 45, the markets often bottomed (except during the financial crisis of 2008-2009)
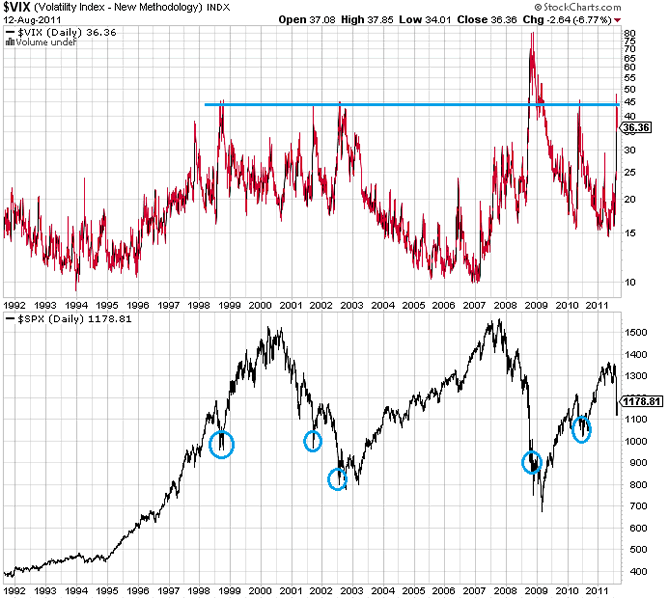
Chart courtesy Stockcharts.com
This is confirmed by the VXO index. Over the last 20 years, the VXO approached the 50-level about 4 times. In 3 out of 4 times, the markets bottomed.
The only time when the markets did NOT bottom, was in 2008-2009, during the Financial Crisis, when the VXO went as high as 85!
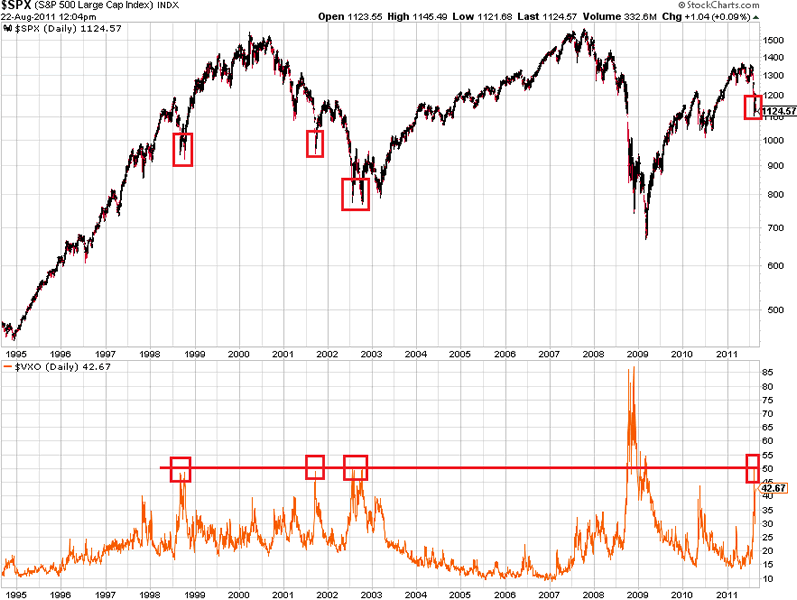
Chart courtesy Stockcharts.com
When we look at the Equity Put/Call ratio, we can see that when this ratio climbed as high as 1.00, the markets often bottomed (at least temporarily). When the Put/Call ratio is high, it means the mass is expecting prices to decline, so they buy put options.
We all know that, when the mass expects something, it often pays to be contrarian.
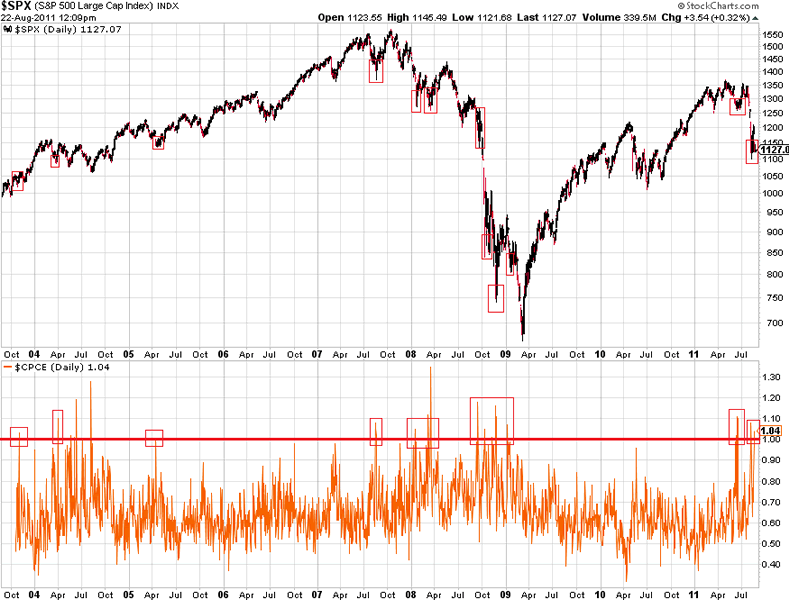
Chart courtesy Stockcharts.com
So, although markets could go a bit lower, there is a pretty high chance that we are AT or CLOSE TO a bottom.
Let’s see what the bond market thinks about that.
The 30 year Bond yield is currently at a long term trend support line. The only time yields fell below this trend line was during the financial crisis of 2008-2009, when investors rushed into the perceived “safe” treasury bonds. Bond yields could possibly bottom here, unless the bottom falls out. Rising bond yields are often related to less risk aversion, and would in this case bode well for stocks.
If the bottom falls out, expect the financial Tsunami of 2008 to be repeated.
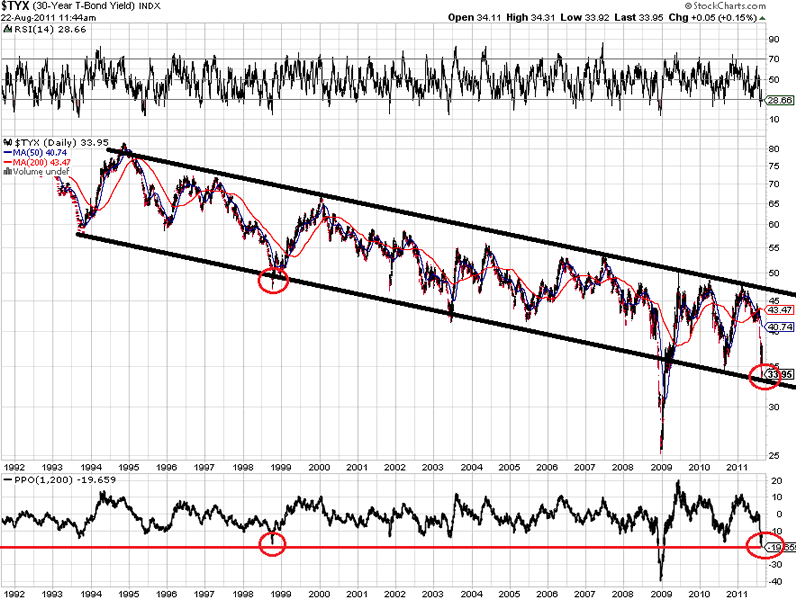
Chart courtesy Stockcharts.com
TLT, which is the ticker of the iShares Barclays 20+ year Treasury Bond Fund, has now hit its all-time high, reached in 2008.
The RSI on a weekly basis is almost as overbought as in 2008, so we could see a potential DOUBLE top being formed here.
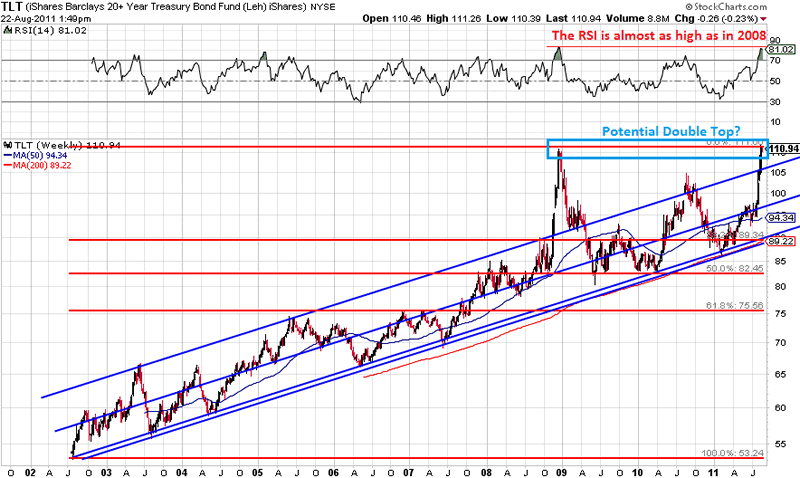
Chart courtesy Stockcharts.com
Less Risk aversion, would probably lead to lower gold prices, as that is the hottest “safe haven” out there at the moment.
Do we see signs of a potential top in gold prices? Maybe. Price is currently at the long term uptrend resistance line, which was created by the tops of 2006 and 2008. Price is now 26.83% above its 200EMA, the highest since 2006, when it was as high as 33.5% above the 200EMA. If gold breaks out above this trend line, I expect price to explode, dwarfing recent gains. I have always said that I expect to see $50-$100 moves in a single day before gold would top. Well, maybe that time is right ahead of us.
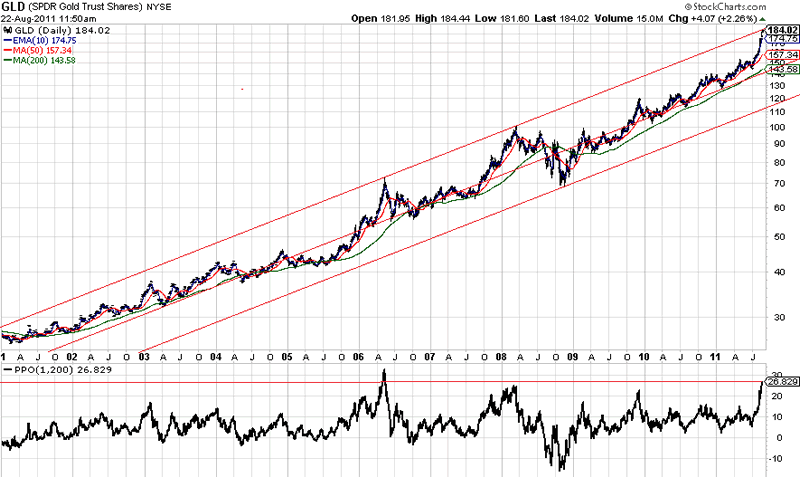
Chart courtesy Stockcharts.com
Much of the above conclusions of course, depend on the potential outcome of the EuroCrisis, so therefore it’s a MUST to analyse the EUR/USD exchange rate.
We can see in the chart below that the EUR/USD retraced 23.60% of the rally from 2010 to 2011. As said before, the 50% level is often a target, so we should expect price to retrace to about 1.34. However, a breakout above the red resistance line could give us higher prices. This could be the result of positive developments in Europe, or worsening developments in the US.
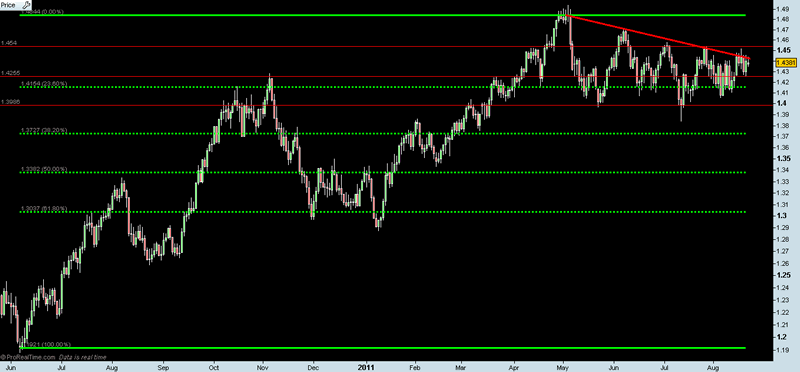
Chart created with Prorealtime
When we look at the long term chart of the EUR/USD (based on the old Deutsche Mark), we can see a similar pattern today as in the ’80s and ’90s. If history is any guide, we could expect the EUR/USD to fall to roughly 1.00-1.10 over the next couple of years…
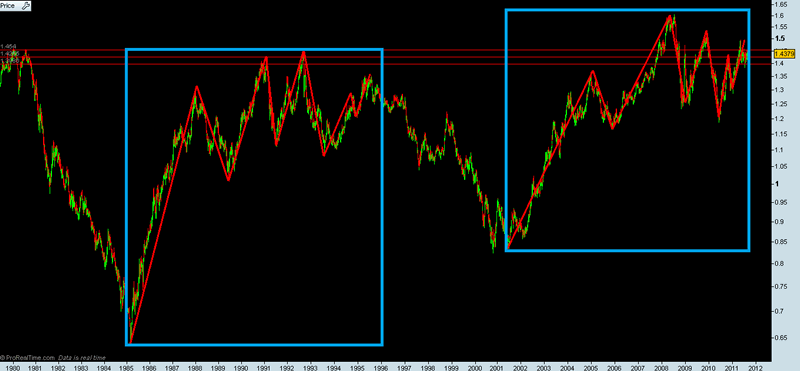
Chart created with Prorealtime
For more analyses and updates, please visit www.profitimes.com
Willem Weytjens
www.profitimes.com
© 2011 Copyright Willem Weytjens - All Rights Reserved
Disclaimer: The above is a matter of opinion provided for general information purposes only and is not intended as investment advice. Information and analysis above are derived from sources and utilising methods believed to be reliable, but we cannot accept responsibility for any losses you may incur as a result of this analysis. Individuals should consult with their personal financial advisors.
© 2005-2022 http://www.MarketOracle.co.uk - The Market Oracle is a FREE Daily Financial Markets Analysis & Forecasting online publication.