


Market Short Squeezes and Trading Ranges, Risk On?
Stock-Markets / Stock Markets 2011 Oct 09, 2011 - 09:01 AM GMT

 Wow!, every time I see one of those short squeezes they still blow me away at the speed and aggression they show, it clearly shows how many are selling this market, as without doubt that was another aggressive short squeeze you saw this past week.
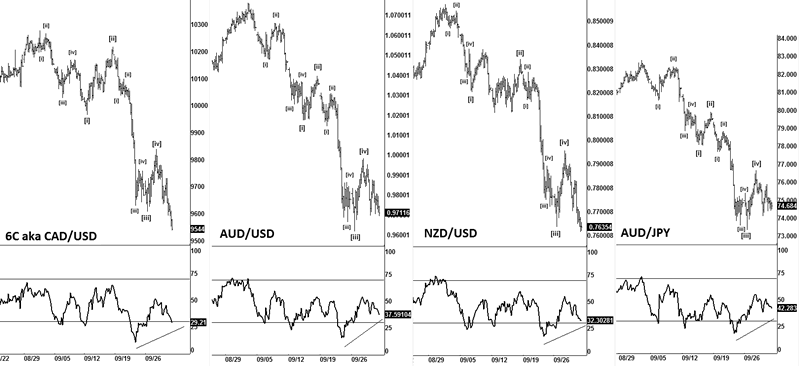
Last week I left you with this chart, and the FX markets were suggesting that we were on the verge of a reversal.
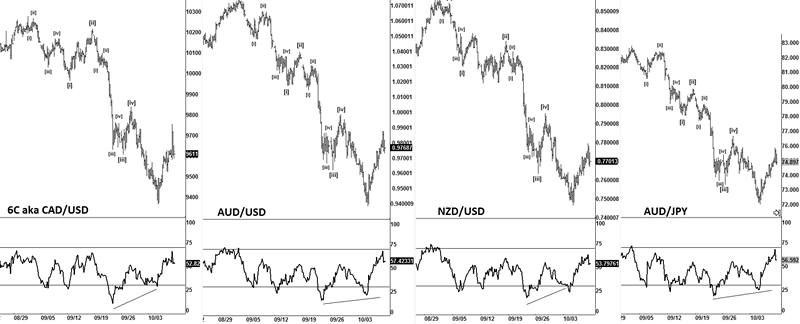
Fast forward to this week, and you can clearly see that the FX markets were signally a move higher, only I can't say I expected it to be so aggressive, by the time you blinked it was up nearly 50 handles from lows on some news, seeing 45 handles in literally 45 mins is something special.
It seems that market is making the upside virtually impossible to trade unless you already were long and anticipating a move like that, whilst we had some clear areas to be careful of such a move higher, as was being suggested by FX risk markets, the speed at which it moved I think took many by surprise, it sure took me by surprise and never really offered much options to get into the trade,3 days and seeing near 100 handles on the ES/SPX is something special, without much of the way of a pullback to offer a decent reward trade. The initial aggressive upside move, and lack of pullback forced the shorts to cover; I suspect did some real damage this week.
So even being right on the direction still don't automatically make you a successful trade, as the move continued higher and just ended as one monster short squeeze, so it was a case of being forced then to just a find an entry to sell the rally once we had seen our targets hit.
Going into Friday, we had some setups on risk markets, and things started to come together as the AUD crosses were suggesting a reversal, as they had met my targets, in just 3 days, what normally would be a 1-2 weeks' worth of move you saw in 3 days, such was the speed of the move you saw last week, a truly breathtaking move.
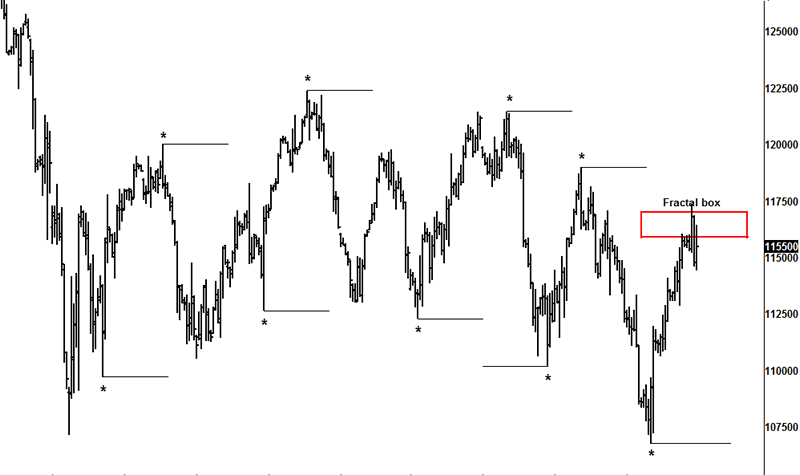
ES
Using the previous fractals we had a boxed target to be looking for around the 58.50-63ES area, but we also had an upper target of 75ES should the market want to see a spike off the NFP.
I have seen those NFP reports ended rallies on numerous times, and I suspect that the initial rally/short squeeze you saw this week has indeed marked a short term peak and likely to pullback now probably towards the 1120-30ES as an initial target. (Subject to structure and the FX market ideas).
As clearly the move was extended and got ahead of itself and the momentum was starting to wind down. There was also evidence seen on the FX markets as the decline was impulsive and suggested that "risk off" had indeed kicked in, so Sunday/Monday I am looking for lower prices into some targets, where we can decide if that was all we saw of the markets for "risk on", or indeed we are setting up for a potential move towards 1230-40ES. We won't know till the market pulls back, to help us decide if it will be a buying opportunity for a move towards 1230-40ES.
This time buying a dip can be controlled as you can set parameters on a trade, not buy a falling chainsaw, clear rock steady trading is what we practice, not some fly by night junkie trading.
Opportunities come and go and finding setups is not as hard as you think, if you keep an open mind and prepared to work hard.
Here at WPT, we do the hard work and find those ideas.
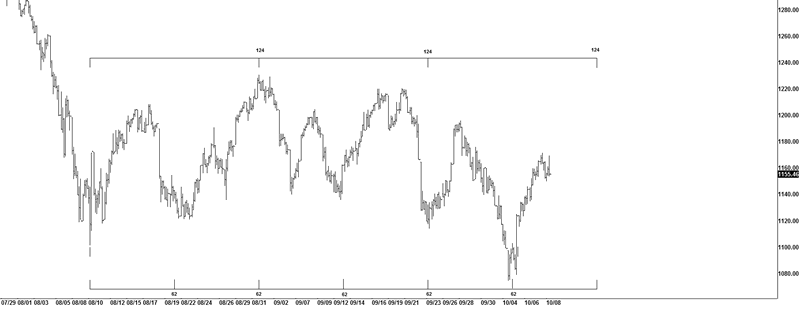
SPX
Another chart we have been using is this 62 hour period chart, and it seems to be working atm, although timing charts come and go, we will continue to use it as long as it suggests a high or low point near, based on the 62 or 124 hour periods.
If we do see a pullback early this week, we are expecting the 1100-1120SPX area to hold and would offer a great spot for a timing low, and set up for a move higher towards 1240SPX.
We tend to think that there is probably more to the move that started this week, and going to give the benefit to the trend, as pretty much the whole of September saw "risk off", so I think the market has probably got more upside coming with regards to time and price, and more "risk on".
Unless we see something that blows away the 1100SPX area on the downside and an obvious price collapse, I tend to think looking at any dips the market markets around 1100-1120SPX as a buying opportunity, we hope to narrow it down over time as my work is based predominately on price and structure with timing as a backup.
The past few months have been anything but a trending move, so it's vital to try and use every edge you can find as I suspect these markets are making traders pull their hair out with the wild swings we are seeing.
Wave counting is only one aspect of the work I do, and in these sort of market especially US stock markets, there is clearly a battle going on in this large range, which is approx a 150 range of chop.
Traders need to either stand aside if they are not comfortable with the moves or look to other markets, I have actually found currently the FX markets are more clearer and suggesting the moves on stocks prior to the move, so it's an edge I strongly think traders in equities should follow if they want to keep on top of the moves.
Trading every single gyration as well is not necessary, take the high confidence setup that you are happy trading, being flat and having no trade on in this market at times can have its advantages, as it gives you a clear head for making your next trade based off a solid plan.
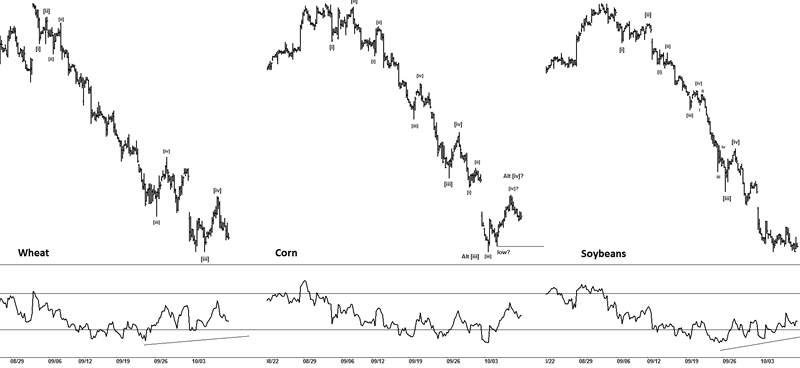
Grains
Looking around, it's clear that another set of markets also got hammered on that blood bath we saw in September, and the grains got punished as well. However I suspect that the initial heavy downside move that has been seen in the grains complex is likely and probably drawing to an end, as all 3 markets are suggesting a low is near and ending a 5 wave move, if that's the case then a retracement to correct the decline is due.
Conclusion
The markets are back into the range we have been trading for the past 2 months, but we do suspect now that if a dip that holds around the 1100-1120SPX area, it should offer a decent buying opportunity for a potential target of 1240SPX, unless we see an outright collapse of price we favor a dip 1st early next week and then setup a move higher.
It would need something special to reversal the squeeze we have seen this past few days, whilst I can never rule out other ideas, the probabilities suggest higher prices, but we are looking for a dip to help decide based on price and structure, if a decent upside move, it will setup for the rest of October and into November.
Using the FX markets as a barometer is helping us navigate this choppy range, and we suspect we got some un-finished business with a trip to 1240SPX.
Until next time.
Have a profitable week ahead.
Click here to become a member
You can also follow us on twitter
What do we offer?
Short and long term analysis on US and European markets, various major FX pairs, commodities from Gold and silver to markets like natural gas.
Daily analysis on where I think the market is going with key support and resistance areas, we move and adjust as the market adjusts.
A chat room where members can discuss ideas with me or other members.
Members get to know who is moving the markets in the S&P pits*
*I have permission to post comments from the audio I hear from the S&P pits.
If you looking for quality analysis from someone that actually looks at multiple charts and works hard at providing members information to stay on the right side of the trends and making $$$, why not give the site a trial.
If any of the readers want to see this article in a PDF format.
Please send an e-mail to Enquires@wavepatterntraders.com
Please put in the header PDF, or make it known that you want to be added to the mailing list for any future articles.
Or if you have any questions about becoming a member, please use the email address above.
If you like what you see, or want to see more of my work, then please sign up for the 4 week trial.
This article is just a small portion of the markets I follow.
I cover many markets, from FX to US equities, right the way through to commodities.
If I have the data I am more than willing to offer requests to members.
Currently new members can sign up for a 4 week free trial to test drive the site, and see if my work can help in your trading and if it meets your requirements.
If you don't like what you see, then drop me an email within the 1st 4 weeks from when you join, and ask for a no questions refund.
You simply have nothing to lose.
By Jason Soni AKA Nouf
© 2011 Copyright Jason Soni AKA Nouf - All Rights Reserved
Disclaimer: The above is a matter of opinion provided for general information purposes only and is not intended as investment advice. Information and analysis above are derived from sources and utilising methods believed to be reliable, but we cannot accept responsibility for any losses you may incur as a result of this analysis. Individuals should consult with their personal financial advisors.
© 2005-2022 http://www.MarketOracle.co.uk - The Market Oracle is a FREE Daily Financial Markets Analysis & Forecasting online publication.