


Silver at Crossroads, Analysis Suggests Should Go Much Higher
Commodities / Gold and Silver 2011 Oct 21, 2011 - 01:15 AM GMTBy: Hubert_Moolman

 Below, is my latest update to subscribers of my Premium service (14 October 2011)
In a previous update on silver, I illustrated the high correlation between how gold and silver trades. Importantly, how they trade similar, at similar milestones, despite the fact that those milestones might be reached at different times.
The similar milestone that is relevant for silver’s current and immediate future is of course the 1980 high. Gold made a triangle-type pattern just before it reached the 1980 all-time high. When it came out of that triangle pattern, it rallied strongly to the 1980 high, which started the formation of a flag-type pattern. From the flag pattern, price shot upward to the $1000 level (pass the 1980 high).
Silver is still following the pattern of gold, around its 1980 high, with the exception that, its down-side action is “deeper” than that of gold. The depth (its fall to $26) of the pattern that started forming since it reached the 1980 high again, is deeper ($30 was the deepest that I expected) than what I had anticipated, based on gold’s pattern. However, this appears to have been just a flash crash (provided we do not go there again).
Below is the silver chart:
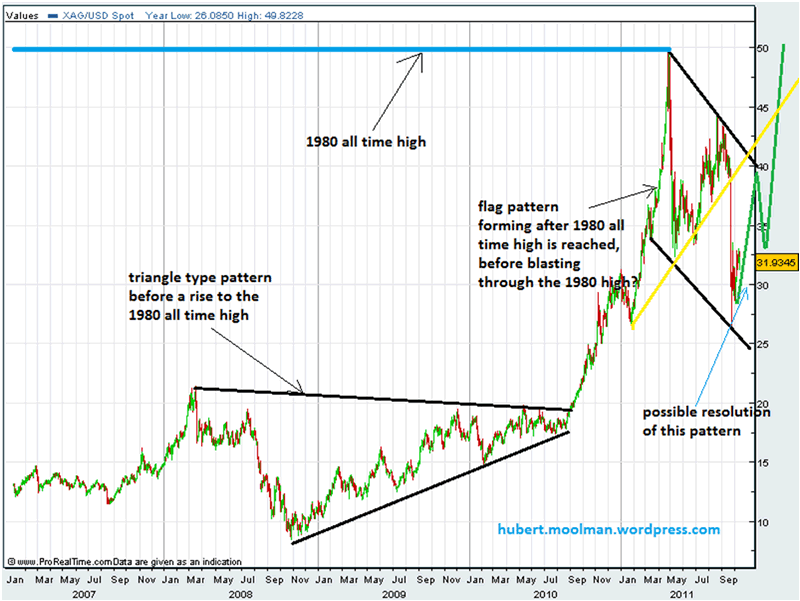
On the chart I have highlighted the 1980 all-time high. You will see the big triangle type pattern just like one that formed on the gold chart (refer to my 15 June silver update). Out of the triangle it rallied strongly to the 1980 high (just like gold did). After reaching the 1980 high, it fell back, and appears to be forming the flag-type of pattern just like gold did.
The current pattern on the silver chart is in fact a highly bullish pattern. It is consistent with that which forms right before price goes parabolic. However, this type of pattern is also similar to that which forms just before we have a severe decline. That, I believe, is the reason why opinion is always divided before one sees a huge rise in price. This is illustrated below, on the silver chart:
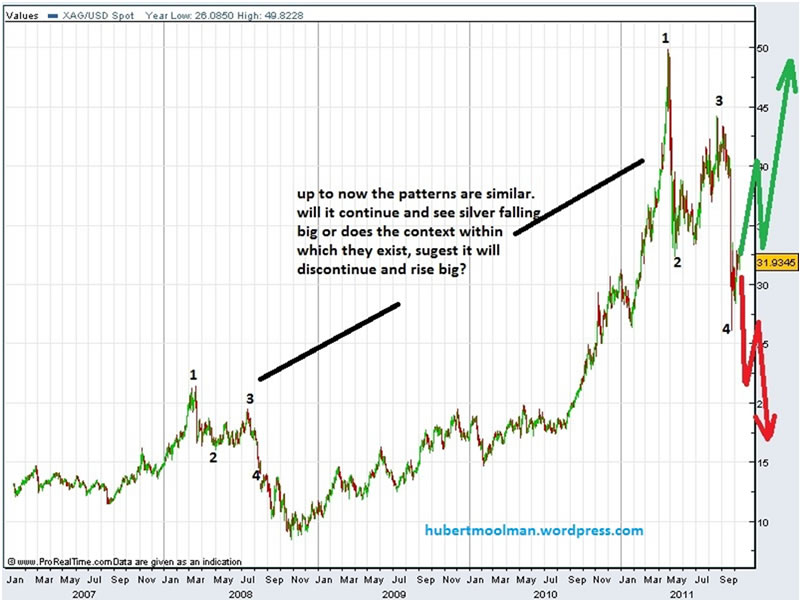
The chart is self-explanatory. As you can see, we are at a major crossroads. We will either have a massive rise in price, or a major fall. In order to be able to make the right decision, we have to look at two important things.
- Context – Are the context in which the two patterns exist similar? Let us see. This is a very difficult one, far difficult than the similar one I was faced with when gold was in a similar position in July 2010. The top that was formed at point 1 in 2008 was a major top. Silver had been rallying for more than 5 years until then. Is the top at point 1 in 2011 a major top? I cannot say for sure. It could be, however, it came about 8 months after a huge (almost 30 month) deep consolidation. The first top came about 6.5 months after an almost 15 month consolidation. Given that the length of rallies are often relative to the size of the consolidation, one would expect a major top to only arrive much later than the top in 2011. At least another 5 months later, based on the pattern of the 2008 top. The 2008 top came at a time when there was a big aversion to risk. The current conditions are similar. However, there is case to be made for the fact that precious metals could now move contrary to the general market (as gold has mostly done since July 2011) during this risk-aversion episode, because it is the monetary system that is now at question. This could especially be true due to the crisis now being more about sovereign debt compared to 2008. I will stop here regarding context, but just conclude and say that I am biased towards believing (because of this and all previous analysis) that the context of this 2011 top is different to that of 2008, and suggests that the pattern will follow the green path instead of the red. We still have to look at confirmation standards before making a final decision.
- Confirmation standards – Based on the look of the two patterns it appears that the $33.55 and the recent low of $26 dollar are the two key levels. A break above the $33.55 level might suggest that the pattern is following the upward parabolic path, whereas a fall below the $26 level suggests we will follow the red path and have a dreadful fall. If we break above the $33.55 level, which I believe we will, we still have to break out of the flag indicated in the first chart. It also eventually has to go through the yellow line indicated on the first chart.
Conclusion
We are at a crossroads, and have to be watchful. Despite the fact that all my analysis suggests that silver should go higher, much higher, we still have to be watchful and pay close attention to the confirmation standards. Key resistance levels could be $40, the yellow line in the first chart and then $55 dollars. Interim targets could be $70 and then $90.
Please send me an e-mail, if you would like to join my premium service.
Warm regards and God bless,
Hubert
Please visit my blog and website for more of my work and premium service. http://hubertmoolman.wordpress.com/
You can email any comments to hubert@hgmandassociates.co.za
© 2011 Copyright Hubert Moolman - All Rights Reserved
Disclaimer: The above is a matter of opinion provided for general information purposes only and is not intended as investment advice. Information and analysis above are derived from sources and utilising methods believed to be reliable, but we cannot accept responsibility for any losses you may incur as a result of this analysis. Individuals should consult with their personal financial advisors.
© 2005-2022 http://www.MarketOracle.co.uk - The Market Oracle is a FREE Daily Financial Markets Analysis & Forecasting online publication.