


Euro and Forex Markets Analysis
Currencies / Forex Trading Oct 25, 2011 - 06:20 AM GMTBy: Capital3X

 Many believe that EUR action is all about Dollar Index. We disagree. The times we live in now are no more led by Dollar action but rather by EUR action given the tremendous implications of what is happening in EU zone. Who would have thought that a disparate group of politicians, each subservient to their political goals and with a tinge in common between them would chart a path to common fiscal union. We had doubts as did markets. But for the first time, we feel that fiscal union and treaty change are now a matter of time rather than whether they will happen!
It may not happen now but the counters of this are now presented at the EU Summit and the clash of German led bloc with Anglo Saxon alliance is already reminding that EU now is more politically arrogant and integrated than ever before. We may still see EURUSD disappointed and drop down like a rock but that does not take away the fact that fiscal union is now on the horizon in 2012/13.
But having said that, EU still has a problem. And that is stagnating growth in Germany which has led the powerhouse for the last 18 months. We will be looking at the PMI charts for EU zone as a whole. PMIs have always projected forward quarterly stagnation.
Before we get into intricate details, we do a quick update on where exactly are we with the deficit reduction in PIIGS.
Slow progress is being made among the PIIGS for reducing the deficits. Portugal and Spain lag Ireland which is doing the best.
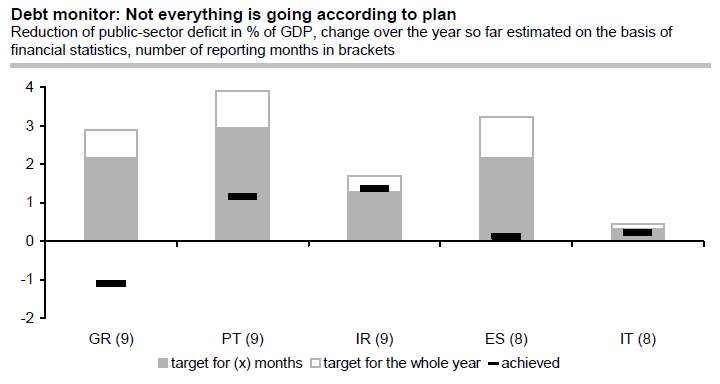
Sources: National financial statistics and Stability Programmes
- Portugal reduced its deficit by about € 2 bn (1.2% of GDP) year-on-year during the first nine months of the year. However, in order to reach the deficit target for the year as a whole (6%) the deficit would have to be slashed by another almost € 5 bn during the remaining three months of 2011 – a goal which seems quite out of reach in view of weak economic growth.
- Spain will probably miss its fiscal target this year.
- Greece austerity package has increased the chances of this year’s deficit coming in below last year’s.
- At the moment Ireland is clearly doing best. In fact, the Irish deficit might narrow somewhat more strongly than planned this year, provided that the economic uptrend of the first half of the year continues.
- Italy will probably reach its quite unambitious goal for 2011, too.
Given the Debt overhang, the technical picture needs to be analysed especially if you are a trend trader as often Technical lead the macro reversals. It is all baked into the price.
EURUSD Weekly Charts
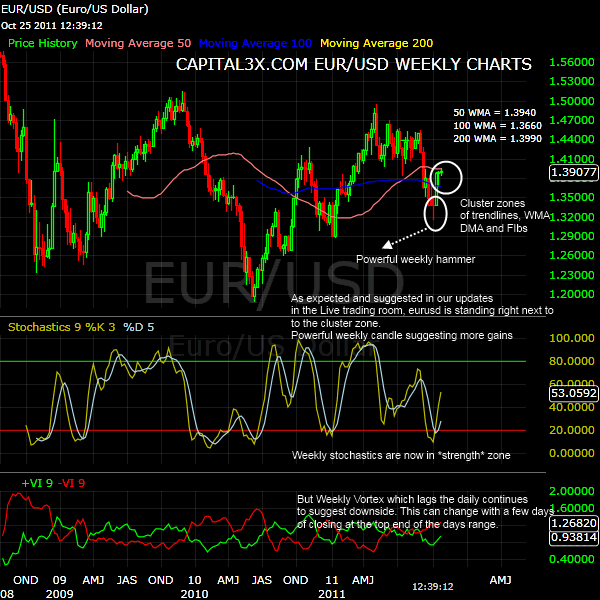
The weekly charts have well advanced after the powerful weekly hammer at 1.315 early October. It also coincided with bearish hammer on the eur volatility charts, both of which together projected the October rally in EURUSD.
- The 9W stochastic is at 53, marginally bullish but we would not read too much into this mild bullish bias yet.
- The Vortex 9W are indicating further falls in EURUSD on weekly.
- The cluster zone at 1.3930 to 1.4050 are well in place. We spoke about this zone when EURUSD was at 1.3660 and how this zone will magnetically attract the price action. It has been validated now as EURUSD entered the zone a high of 1.3960 a level at which we shorted the market and netted over 120 pip.
EURUSD Daily Charts
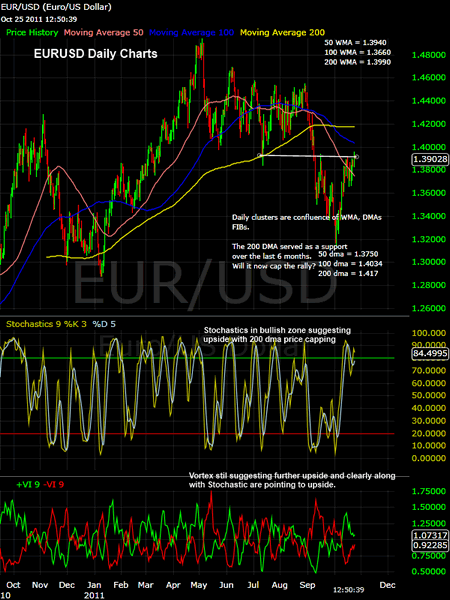
The 200 DMA has been supporting price action over the last 6 months but now may be capping the rally at 1.42 levels. It is not a coincidence that price action is so near to this level at the importance of the EU Summit on wed.
If they do implement Rompuy proposals for a common treasury at Frankfurt, then this cluster zone is history as EURUSD will soar.
Looking at other charts to understand price action will help us. EUR Volatility are always a good indication of ground realities.
EUR Volatility charts (weekly)
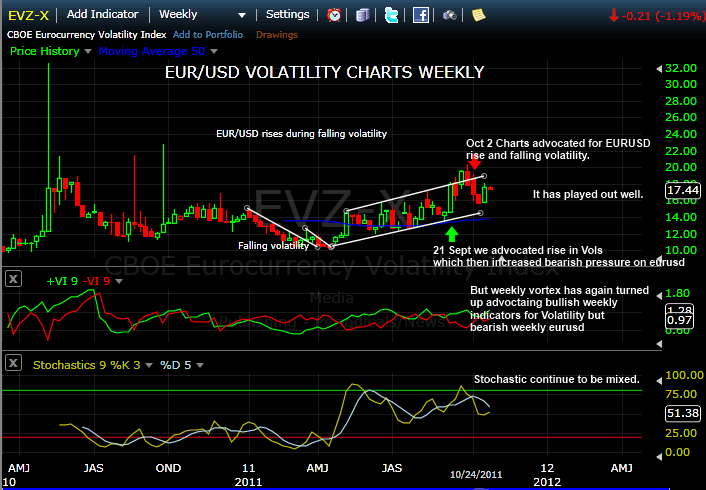
As always EUR volatility continues to be one of the best weekly trend tools which allow us to judge the actual lending volatility on eur pairs. Higher volatility means higher uncertainty and therefore bearish pressure to rise on the pair. Volatility also derives itself from euribor rates which accurately gauge the ground realities between banks lending in the euro zone.
The volatility is now stabilizing at 17 levels which can be considered to be high but well inside the well behaved uptrend. Stochastic and Vortex continue to forecast mildly bullish bias for the volatility.
This is what we said about EUR volatility on 2 October and how well was that chart predicting the rally of October. EUR Volatility predicting upside.
A quick look at the EURIBOR charts will also tell us about the rising stress in the system even with the EU summit underway. This can be considered an important *macro bearish divergence* in the EURUSD price action.
EURIBOR Charts
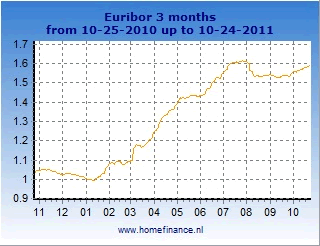
Euribor came in at 1.588% which is the highest clocked this year and is clear indication of the worsening situation in EU banks. Interbank lending is getting stressed. But the Interbank overnight Eonia is at 0.937% well below the 1.22% of October 10, 2011.
To Gauge the normal market risk perception, important to understand general trends in Dollar Index.
Dollar Index (Monthly)
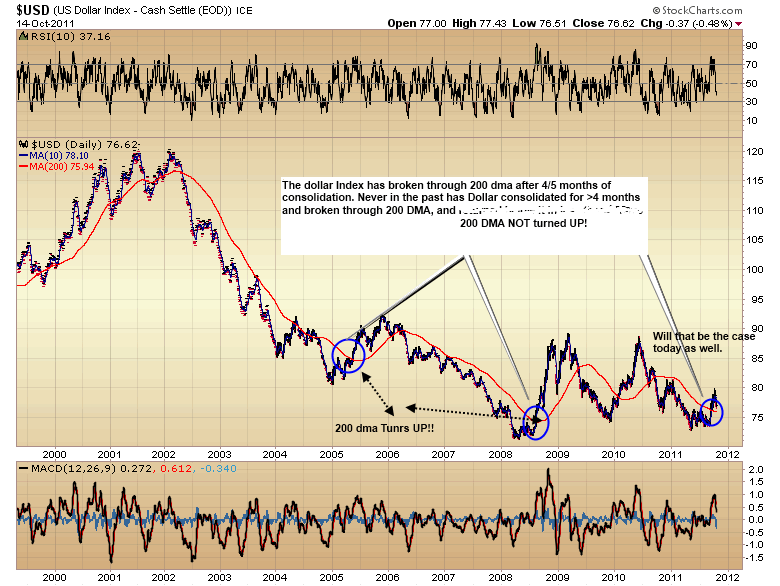
The dollar index has broken through 200 DMA right after the FED announced the Twist operation with the short term yield yanking upwards and pulling the Dollar upwards. The dollar breakout came after 4 months of consolidation and as seen in the past, every such breakout was accompanied by a trend change in the 200 DMA as it turn back up. Will that be case this time around?
The Aussie pairs are an important parameter to judge risk which is a direct derivation of trade and capital flows into commodity rich countries like Australia. It also derives it internal from China where Yuan is not yet fully floated.
AUD/USD Daily charts
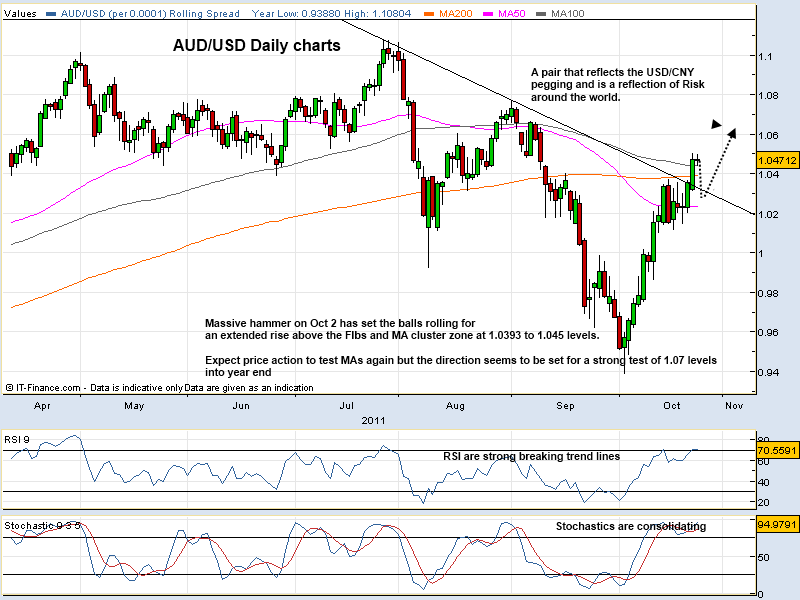
The AUD/USD pair has broken out and is now leading the way to 1.07 levels by year end. The currency is gaining in strength in our indicators and we expect a strong move to 1.07. The vortex indicator has crossed over bullishly, the stochastic are well above 75 levels and RSI is well positioned. The AUD/USD broke out after China reported PMI above 50 indicating expansion. The markets have taken this as a sign of an economy which is resilient even in the wake of high borrowing rate.
Bunds too are indicating that the October RISK rally (predicted by us on Oct 2) may just extend into the year end.
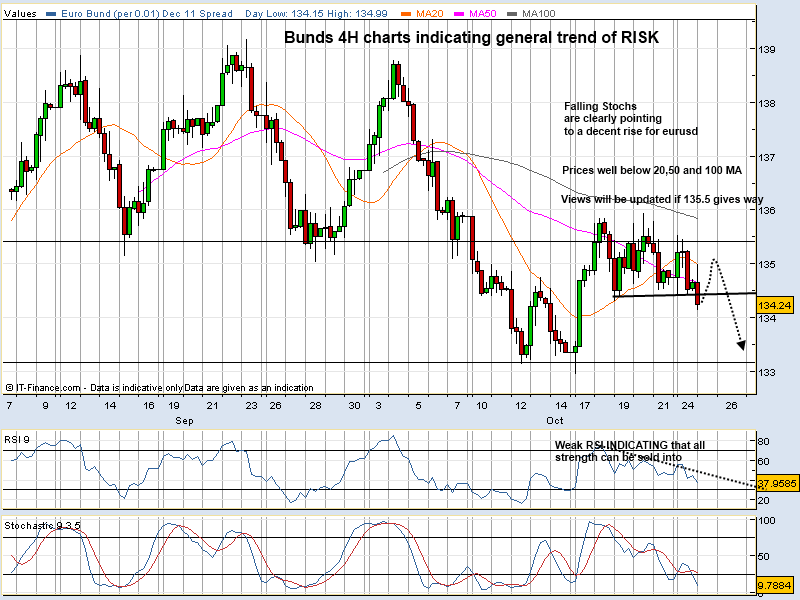
Bunds have led the powerful eur rally as rising yields in a benign credit market, have supported flows into equity/risk markets. How will this change on Wed Oct 26 2011?
A look at DAX charts will indicate the point we are making with Bunds and AUD/USD pairs.
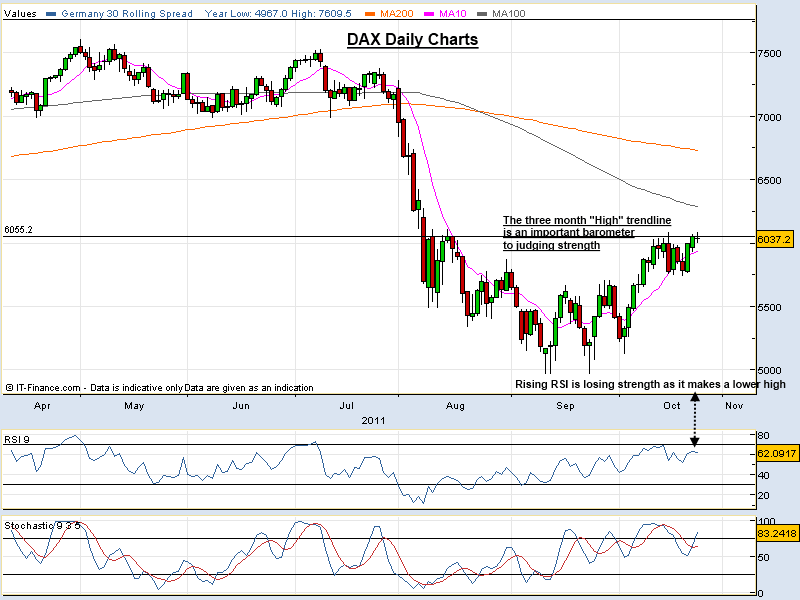
Our subscribers were alerted on [10 Oct ] when DAX was at 5790/5830 that a rally to 6060 was in the making and it was based on two pillars:
Falling Bunds which broke 135.2 and AUD/USD which pulled itself above 0.9880 both of which lent strength to our internal indicators on RISK.
We also need to update our analysis on the fundamental drivers which are weakening EU economy. So even if the debt crisis does not get worse from here, there is still the question of the secular growth story.
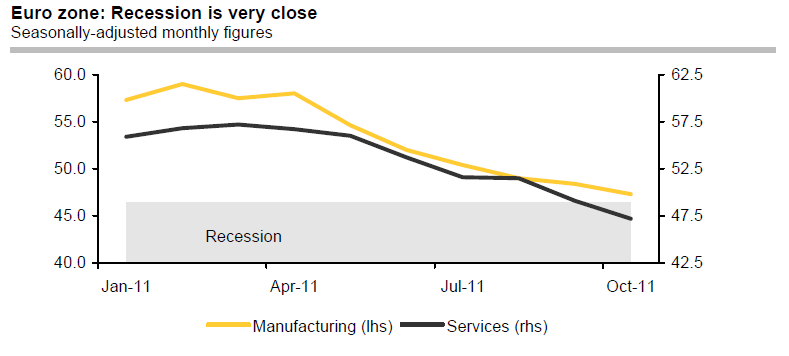
Source: Reuters
The leading indicators continue to fall. The purchasing manager index for manufacturing industry fell by a further 1.2 points in October 47.3. The index for the service sector dropped by 1.6 points to 47.2 – level at which in the past the Eurozone economy has shrunk. This shows that the uncertainty provoked by the sovereign debt crisis has reached danger point.
The euro economy is likely to have grown by a respectable 0.3% from Q2 to Q3. The outlook for the final quarter is increasingly gloomy, however. We expect economic output to decline by 0.2%. For 2012 as a whole we expect the Eurozone economy to stagnate. But even this is based on the assumption that the sovereign debt crisis does not get any worse. In the event of an uncertainty shock like that which followed the collapse of the American investment bank Lehman Brothers, the Eurozone economy would contract significantly on average over 2012.
We will be further updating our analysis on latest from the Bond and Forex markets as we analyse and trade trends into November. Markets are setting up for a strong move on either side into the year end and inter-market gives you advance warning as we have observed over the last few years and months.
Our feeds: RSS feed
Our Twitter: Follow Us
Kate
Capital3x.com
Kate, trading experience with PIMCO, now manage capital3x.com. Check performance before you subscribe.
© 2011 Copyright Capital3X - All Rights Reserved
Disclaimer: The above is a matter of opinion provided for general information purposes only and is not intended as investment advice. Information and analysis above are derived from sources and utilising methods believed to be reliable, but we cannot accept responsibility for any losses you may incur as a result of this analysis. Individuals should consult with their personal financial advisors.
© 2005-2022 http://www.MarketOracle.co.uk - The Market Oracle is a FREE Daily Financial Markets Analysis & Forecasting online publication.