


Dollar Breakdown Triggers Stock Markets Risk Rally, It's All About the 3's
Stock-Markets / Financial Markets 2011 Oct 30, 2011 - 04:45 AM GMT

Dollar Breakdown Triggers Stock Markets Risk Rally, It's All About the 3's
 Last week I wrote about the key support that needed to hold for the DX at 76.50, the rest is history, but it's clearly obvious with the strength that we saw towards the middle of the week in risk markets, you saw a significant breach of that support, which suggests that all we saw is a 3 wave rally.
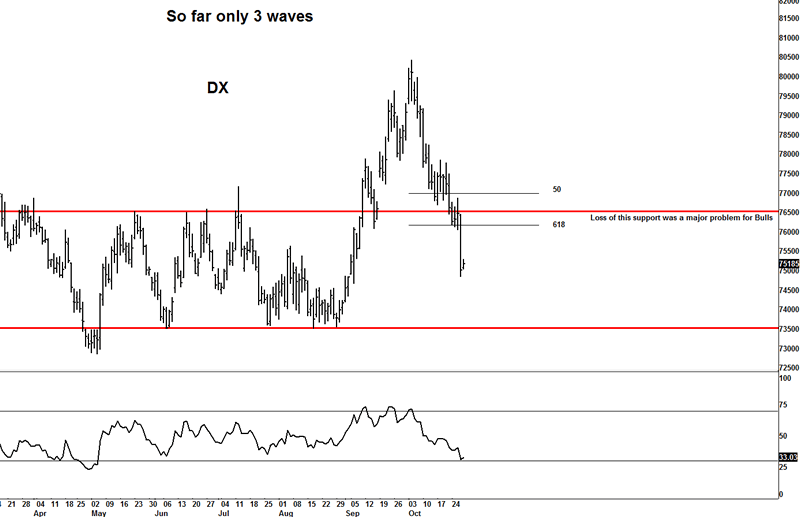
Now to non Elliotticians that don't mean much, but to Elliotticians a 3 wave move is a correction (or part of one) against the trend, in the case of the US$, the odds say that the overall move is corrective and the on-going trend is still down and more downside is looming ahead for the US$.
Most will note the obvious correlation to the US$ and other risk markets, as the US$ goes up other markets get sold, and vice versa, as the US$ gets sold aka the DX you see risk markets go higher, which is pretty much what you have seen this past month in October, so whilst it was only a 3 wave move on the upside for the US$, there still potentially a number of patterns we cannot discount going forward, unfortunately most are bearish for the US$.
The bulls had the chance to make something on the rally they got, but all told, the past months destruction of the US$ is sending a clear message, that message is likely more risk "on" and likely to see the US$ push lower over the coming months.
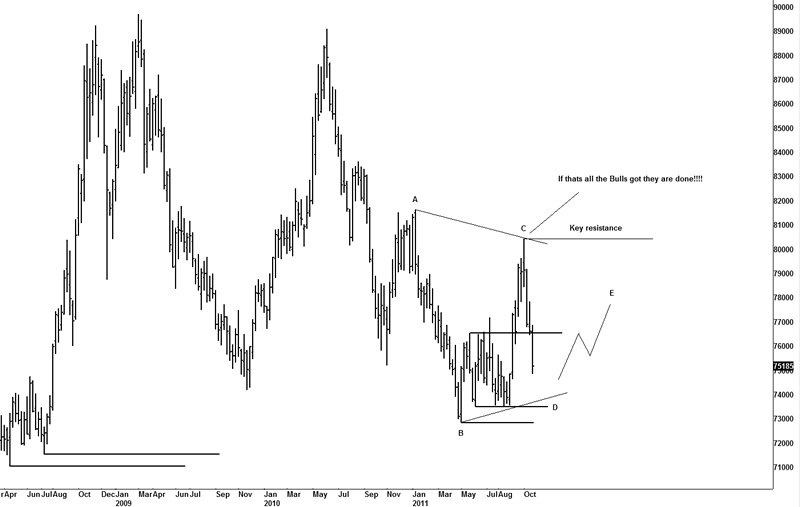
However there is a few possibilities I am looking at and it really comes down to what the markets are doing from the Oct 4th lows (highs for the USD/CAD and DX) in that if only a 3 wave rally if could be part of a corrective pattern, as a X wave or even wave D of a triangle.
Although if a X wave, that idea suggests a reversal back to the Oct 4th lows on the risk markets, or in the case of the triangle idea only a partial decline.
Simply put the markets would need another crisis to see strength in the US$, and frankly seeing as the markets only really sell off now when there is a crisis, it would be a hard sell to think another crisis is looming so close to this one, as the Europeans have shown they are willing to bail out virtually everyone and everything.
I am kind of partial to the idea of a triangle talking shape and what you are seeing now is wave D of the triangle and a rally should see some of this decline retraced, that may see towards 1150SPX in the SPX.
Until we actually see if this rally is 3 waves from the Oct 4th highs, we won't know if the next move is part of this triangle, but I am starting to put some weighting on this idea.
If the DX is tracing out a triangle then the overall direction is more downside for the US$ and likely to be more upside for risk markets over the coming months ahead.
Risk FX pairs
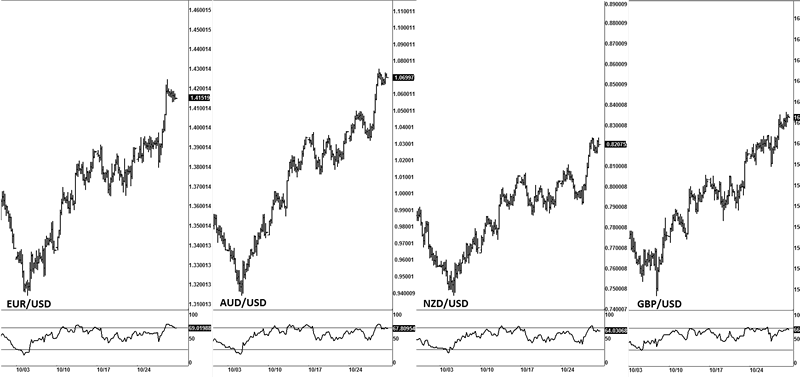
So far there appears to be a 3 wave looking move, you can see the same on Crude oil, so that is a key component going forward to help decide.
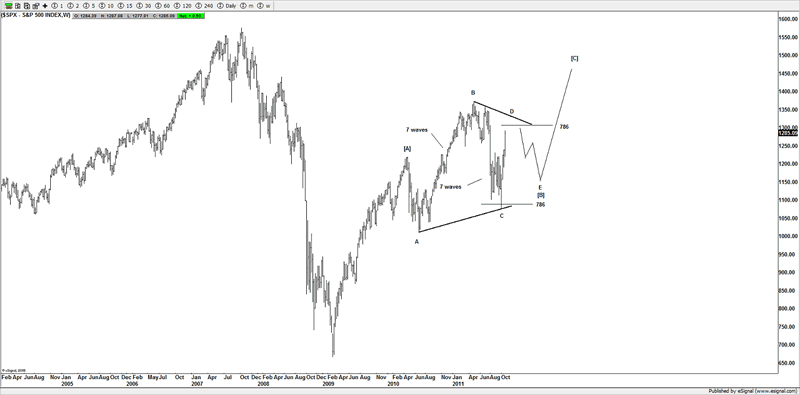
SPX
With the obvious weakness in the DX it stands to reason that following the US$ aka the DX is key to knowing, or where stocks could move, it's not always the case of this close correlation, but presently there is a correlation, and it's worth noting the movement of the US$, traders imo still need to follow that correlation.
So if the DX is working some sort of triangle, I suspect in wave D now, and any decline in stocks could be a wave E, then see the DX rally in its respective wave E.
Most bears still think the high is in for this year and a multiyear high is in place on stocks, however the destruction shown in the US$ imo is something that could change that idea.
Imo that move seen on the US$ is something to respect and the idea shown here is a serious contender now for a valid idea going forward, what we are now in doing is a wave D and if it remains as 3 waves from the Oct 4th lows, a 3 wave decline towards 1150SPX, it would align with a decline in the EUR/USD pair as well as a bounce for the DX as shown above.
I suspect now over the coming few months we are going to probably stay in a range of about 100 handles or so.
Although any move that gets aggressive above 1310-1320SPX will put pressure on this idea.
Whilst I was looking for a move towards 1240SPX, I was not thinking that the market would see such an aggressive move, and one that generally marks a major low in stocks.
Let's just say that I am now 50% back into my bull suit, I tend to think that we are going to be stuck now in a range if this triangle plays out, but if so the Oct 4th lows actually marked an important low that won't be seen for a while.
Short term, I still do think that a short term high is near and a decent correction is due and maybe 100-150 SPX points, so it's something that I am focusing on, but you may have indeed seen an important low at the Oct 4th lows.
The key imo was the DX getting mauled.
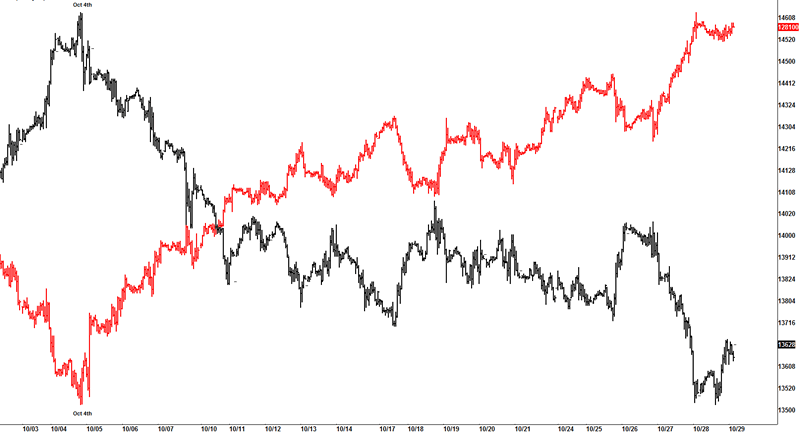
ZB Vs ES
This chart tells the picture, as long as the DX goes down and ZB follows, the bulls in risk markets are firmly in control, and those bulls that bought into the highs of the ZB move, are running to get out and run back into stocks which is what you have seen, fear has abated and risk is back with a vengeance, whilst there can be a decent correction in stocks, if this is the start of some sort of collapse in the US$ and ZB (30 yr bonds) then I suspect risk is just getting started, however the preferred move is that it's a 3 wave rally and coming to a termination as a ABC and see a sharp correction, somewhere around the 1300-1310SPX area., then any decline is potentially wave E of a larger triangle.
So watching signs to see if traders are moving back into safety of the US$ and ZBs, before I think a reversal is setting up in risk.
Conclusion
The rally over the past month is somewhat similar to rallies that have marked major lows, and imo it's something to respect.
The key to the move will be if the rally is in 3 waves, as whilst it can be a X wave (idea not shown) and see back to the Oct 4th lows, there is the option of a triangle and whilst we would see a decent pull back it would not surpass the Oct 4th lows and what saw at the Oct 4th was a low that won't be taken out for a long time coming.
Simply put its about the US$, and until that gets some life no way can you sell risk, although short term I am a buyer of risk on dips as long as the DX is under 76. So as the DX pushes higher risk will push lower, you wait for the DX to top any correction and choppy advance, and then you buy risk.
The DX has a key line in the sand atm, whilst it's below 76, buy risk on dips if the market allows you to.
But respect any aggressive move above 76.50.
What that don't mean is buy the highs on risk markets, what it means is that a correction still should be near and one that could be a decent move , but looking ahead its likely to be a correction, not the dreaded wave [3] to the depths of the earth as the bears wish.
There is a fine line with being true to price action, those that have a perma-bias only see what they want to see, whilst I was looking for a reversal to happen from the 76.50 area in the DX, it clearly never happen, and I have to respect that and find answers to the markets potential path going forward.
That's being objective with what I see, not want I want to see, the difference is I am willing to kill an idea and be true to what the market is saying NOT what I want to see. I got no issues being wrong, clearly the market made a statement and I am listing.
The breach of such an important area at 7650, saw the huge moves we saw this week, and the key was the US$ in self destruction mode, you can see that on the outflow of bonds (ZB).
Both the US$ aka DX and ZB (30yr bonds) were in a vertical lift off move, as was the USD/CAD pair, but now that the markets think the worst is over, there are happy to buy risk, or should say have been happy to buy risk. Hence you saw the destruction in the US$ and ZB and rallies in risk markets such as the ES, AUD/USD and EUR/USD etc.
As long as that remains so it's a buyer's market in risk.
Those that ignore that message imo are not reading the market correctly.
Until next time.
Have a profitable week ahead.
Until next time.
Have a profitable week ahead.
Click here to become a member
You can also follow us on twitter
What do we offer?
Short and long term analysis on US and European markets, various major FX pairs, commodities from Gold and silver to markets like natural gas.
Daily analysis on where I think the market is going with key support and resistance areas, we move and adjust as the market adjusts.
A chat room where members can discuss ideas with me or other members.
Members get to know who is moving the markets in the S&P pits*
*I have permission to post comments from the audio I hear from the S&P pits.
If you looking for quality analysis from someone that actually looks at multiple charts and works hard at providing members information to stay on the right side of the trends and making $$$, why not give the site a trial.
If any of the readers want to see this article in a PDF format.
Please send an e-mail to Enquires@wavepatterntraders.com
Please put in the header PDF, or make it known that you want to be added to the mailing list for any future articles.
Or if you have any questions about becoming a member, please use the email address above.
If you like what you see, or want to see more of my work, then please sign up for the 4 week trial.
This article is just a small portion of the markets I follow.
I cover many markets, from FX to US equities, right the way through to commodities.
If I have the data I am more than willing to offer requests to members.
Currently new members can sign up for a 4 week free trial to test drive the site, and see if my work can help in your trading and if it meets your requirements.
If you don't like what you see, then drop me an email within the 1st 4 weeks from when you join, and ask for a no questions refund.
You simply have nothing to lose.
By Jason Soni AKA Nouf
© 2011 Copyright Jason Soni AKA Nouf - All Rights Reserved
Disclaimer: The above is a matter of opinion provided for general information purposes only and is not intended as investment advice. Information and analysis above are derived from sources and utilising methods believed to be reliable, but we cannot accept responsibility for any losses you may incur as a result of this analysis. Individuals should consult with their personal financial advisors.
© 2005-2022 http://www.MarketOracle.co.uk - The Market Oracle is a FREE Daily Financial Markets Analysis & Forecasting online publication.