


Stock Market Inflection Point
Stock-Markets / Stock Markets 2011 Dec 26, 2011 - 12:01 PM GMTBy: Toby_Connor

 After a rough beginning on monday US stocks surged tuesday, following the ECB’s successful LTRO results, then continued higher for the rest of the week. For the week the SPX/DOW were +3.65% and the NDX/NAZ were +2.25%. Asian markets gained 0.6%, European markets surged 3.5%, and the DJ World index rose 3.0%. Economic reports in the US were mixed, with positives outnumbering negatives 8:7. On the uptick: NAHB, housing starts, building permits, consumer sentiment, durable goods orders, new home sales, the monetary base, and weekly jobless claims improved. On the downtick: existing home sales, Q3 GDP, leading indicators, FHFA, personal income, the M1-multiplier and the WLEI. Next week, a holiday shortened week, Case-Shiller and the Chicago PMI.
LONG TERM: inflection point
As 2011 comes to a close we have the opportunity to reflect on this tumultuous year. It started off well enough, with bullish expectations as the market made new uptrend highs in February and then again in May. Then, it appeared, the weakening foreign markets started to take their toll on the US market. After a downtrend into June and a lower uptrend high in July, the first of the bull market, we all sensed there was trouble ahead. In August daily swings of 500 DOW points started to become common place. On the second trading day of October the market had dropped 22% from its May high. On that day, the EU announced they were committed to re-capitalizing Europe’s banks and resolving the sovereign debt crisis in Europe. The market started to recover on the news. Eighteen trading days later, by late October, the SPX had retraced nearly 74% of the entire decline. Three months later the EU has only plans and more plans to show for their efforts. The market dropped 10%, in just four weeks, after the late October high. Now the market is trying to head back to those October highs. The first half of the year was filled with hope. The second filled with volatility and uncertainty.
After the May11 SPX 1371 high we can count five waves up from the Mar09 SPX 667 low. Then, at the Oct11 SPX 1075 low we can count five waves down from the May11 high. While bull markets are expected to end with five significant waves up. Bear markets are not expected to be just five waves down. Unless, like during the 1987 crash, they form an elongated flat. During that bear market the SPX lost 36% of its value in just four months. The third and fifth waves formed a double bottom. But it took the SPX 18 months before the market recovered what it had lost during the crash, and started making all time new highs again.
Another comparative period is the Oct07-Mar09 bear market. Between Oct07 and Mar08 the market declined in five waves, lost 20%, and then retraced 57% of that entire decline over the next two months into May08. What followed was a five wave waterfall event which finally bottomed ten months later after a total market loss of 58%. Now to the charts.
We are currently carrying three potential counts: one bullish, (the elongated flat scenario on the SPX charts), and two bearish, (an ongoing bear market retracement Major B on the DOW charts, and an ongoing bear market continuation declining Major C on the NAZ charts). All three are potential counts at this time. The reason for the market inflection point in the long term title.
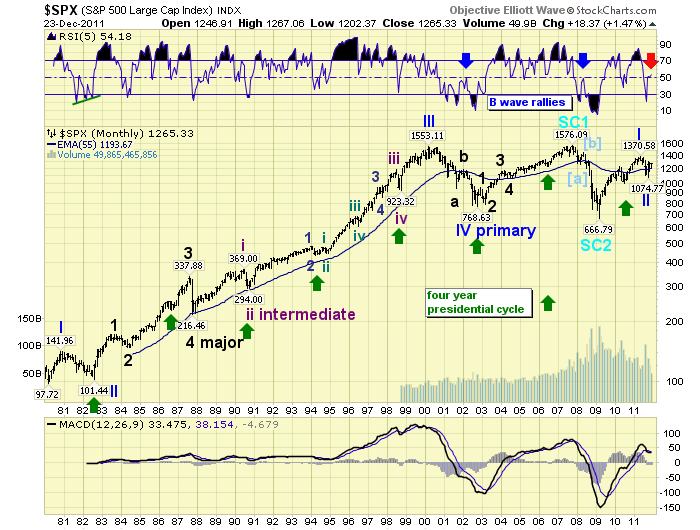
When we review the technicals on the monthly and weekly charts we have yet to see signs of a bull market kickoff/resumption. Nearly three months after the low. The monthly RSI has yet to significantly rise above the neutral line. This failure also occurred during the last two B wave bear market rallies. Plus, the MACD remains on a negative cross.
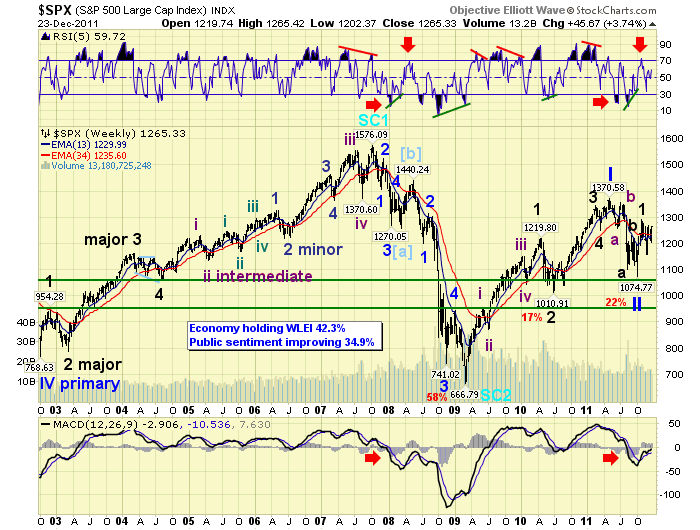
The weekly RSI has thus far topped at the overbought line, which also occurred during the B wave rally during the 2007-2009 bear market. In addition, during bull markets the RSI frequently gets extremely overbought and the MACD remains above neutral. During bear markets the RSI barely hits overbought, gets extremely oversold, and the MACD remains below neutral. Three months off the low and this market continues to display signs of an ongoing bear market. Since this market is still uptrending it still has the opportunity to improve these indicators and reverse the negative long term market sentiment. The next several weeks should be the defining moments for the bull/bear debate.
MEDIUM TERM: DOW in confirmed uptrend, other majors to follow
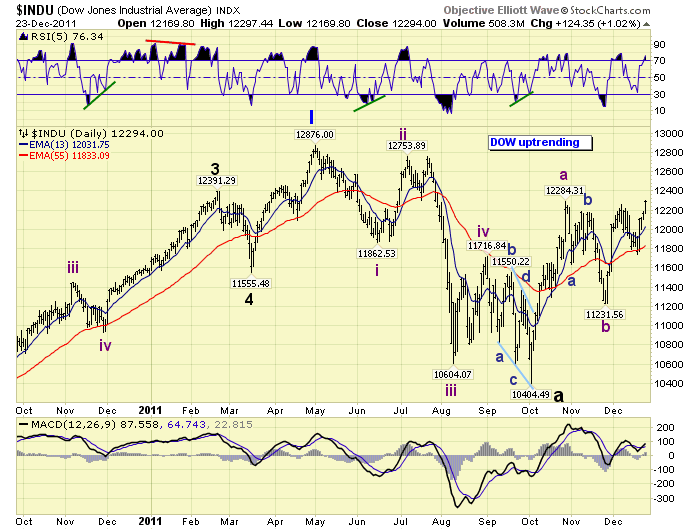
After the explosive 18 trading day 74% retracement rally there was some debate as to the impulsiveness of the uptrend. When the following downtrend was clearly corrective only two options were obvious. One, the bull market had resumed. Two, a B wave bear market rally was dividing into a smaller set of ABC waves. On friday the DOW confirmed the obvious by exceeding the late October high on both a print and closing basis. The market is in the process of completing a Major wave B of an ongoing bear market, or the second uptrend in the kickoff/resumption of a bull market. As noted earlier, the technicals will have to improve dramatically during this uptrend to reverse the negative long term sentiment.
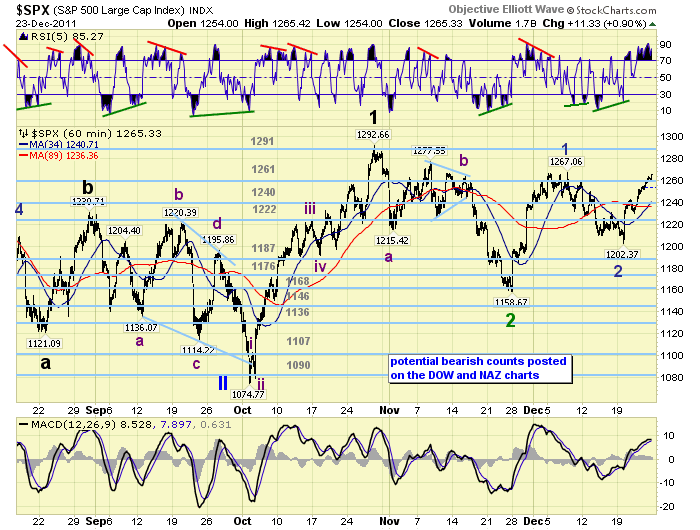
Under the bullish scenario, we labeled the early October low at SPX 1075 as the end of Primary II. We then labeled the October uptrend high at SPX 1293 as Major wave 1 of Primary III. The correction to SPX 1159 was labeled Major wave 2. Since the current uptrend is expected to run into significant resistance between the February-May-July highs, (SPX 1344-1371), we are labeling it Intermediate wave i of Major wave 3. Thus far this uptrend appears to have only completed Minor waves 1 and 2 of the Int. one uptrend. This scenario is labeled on the SPX charts: see SPX 60min chart.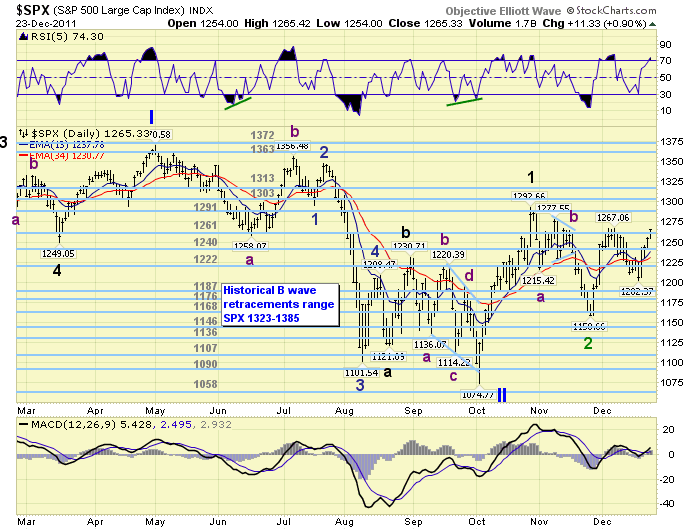
Under the bearish scenario, we labeled the early Ocotber low at SPX 1075 as Major wave A. We then labeled the October uptrend to SPX 1293 as Intermediate wave A of Major B. The correctional downtrend to SPX 1159 in November we labeled Int. wave B of Major B. The current uptrend would then be considered Int. wave C of Major wave B: see DOW daily chart. We have considerably lower targets for this uptrend under this scenario. First, we would expect the uptrend to end around December 29th. Second, the Int. abc Major wave B pattern would be satisified with either a retest of SPX 1293, or slightly higher. There is significant resistance between SPX 1313 and 1327, centering around 1316. The SPX 1293 target can be accomplished by next week. But the higher target will probably require the first week in January to be reached.
SHORT TERM
Support for the SPX is at the 1261 and then 1240 OEW pivots, with resistance at the 1291 and then 1303 pivots. Short term momentum ended the week quite overbought, after hitting extremely overbought. Typically, this should lead to a 10+ point pullback quite soon. The market had a 13 point pullback on tuesday/wednesday after hitting quite overbought on tuesday. The short term OEW charts have been positive since early tuesday, and just need to hold the 1240 pivot to remain positive. Short term support is at the 1261 pivot range, SPX 1250, and the 1240 pivot range. Short term resistance is at SPX 1278, then the 1291 and 1303 pivot ranges. Best to your trading!
FOREIGN MARKETS
The Asian markets were mostly higher for a net gain of 0.6%. Only Hong Kong is in a confirmed uptrend.
The European markets were all higher on the week gaining 3.5%. All but Germany and Spain are in confirmed uptrends.
The Commodity equity group were all higher on the week gaining 2.3%. Brazil and Canada remain in confirmed uptrends.
The DJ World index still has not confirmed an uptrend but gained 3.0% on the week.
COMMODITIES
Bonds remain in an uptrend but lost 0.8% on the week. This market has stayed in a narrow range for about two months.
Crude had another volatile week gaining 6.4%. It’s still in an uptrend with declining upside price progress.
Gold remains in a downtrend gaining 0.5% on the week. Downtrending Silver underperformed -1.8%.
The uptrending USD continues to work its way higher with minor pullbacks. It lost 0.4% on the week while the EUR was flat, and the JPYUSD lost 0.4%. The big winners were the AUDUSD (+2.0%) and the CADUSD (+1.7%).
NEXT WEEK
On monday most markets are closed. Tuesday kicks off the economic week with Case-Shiller at 9:00, then Consumer confidence at 10:00. On thursday weekly Jobless claims, and Pending home sales. Then on friday the Chicago PMI. The FED has nothing scheduled. Happy holidays to you and yours, and thank you for following and/or contributing during 2011. May the market clouds lift in 2012.
CHARTS: http://stockcharts.com/...
http://caldaroew.spaces.live.com
After about 40 years of investing in the markets one learns that the markets are constantly changing, not only in price, but in what drives the markets. In the 1960s, the Nifty Fifty were the leaders of the stock market. In the 1970s, stock selection using Technical Analysis was important, as the market stayed with a trading range for the entire decade. In the 1980s, the market finally broke out of it doldrums, as the DOW broke through 1100 in 1982, and launched the greatest bull market on record.
Sharing is an important aspect of a life. Over 100 people have joined our group, from all walks of life, covering twenty three countries across the globe. It's been the most fun I have ever had in the market. Sharing uncommon knowledge, with investors. In hope of aiding them in finding their financial independence.
Copyright © 2011 Tony Caldaro - All Rights Reserved Disclaimer: The above is a matter of opinion provided for general information purposes only and is not intended as investment advice. Information and analysis above are derived from sources and utilising methods believed to be reliable, but we cannot accept responsibility for any losses you may incur as a result of this analysis. Individuals should consult with their personal financial advisors.
© 2005-2022 http://www.MarketOracle.co.uk - The Market Oracle is a FREE Daily Financial Markets Analysis & Forecasting online publication.