


Stock Market Reversal is Due
Stock-Markets / Stock Markets 2012 Jan 17, 2012 - 01:48 AM GMTBy: Andre_Gratian

 Current Position of the Market
SPX: Very Long-term trend - The very-long-term cycles are down and, if they make their lows when expected, there will be another steep and prolonged decline into 2014.
SPX: Intermediate trend - Intermediate uptrend still intact, but short-term top... or more, is now very close.
Analysis of the short-term trend is done on a daily basis with the help of hourly charts. It is an important adjunct to the analysis of daily and weekly charts which discusses the course of longer market trends.
Market Overview
Deceleration in the SPX is becoming more and more obvious on the Point & Figure chart and in the hourly chart. This, in concert with overbought daily indicators, is a clear warning that we are approaching the end of the trend which started at 1159 on 11/25, and perhaps of that going back to 1075 in early October, as well. Last week, the SPX made a triple-top on its hourly chart (only a double-top on the daily chart), after barely overcoming the 1292 high of Dec. 27. Is this it? Or is there more to come?
Since, as of Friday, there was no clear sell signal, it is possible that we could go a little higher or, at least, continue to work a little longer at expanding the top formation. On the P&F chart, the index has already formed a pattern which looks very much like distribution, with trading confined to a 20-30-point range. If prices fail to break out of this range on the upside or, if there is a break-out of a few points with an immediate retracement into the range, it will be a sign that buyers are exhausted and that sellers are getting the upper hand.
Should this happen, we could identify everything above 1266 as a possible top formation which already measures nearly 100 points across (P&F). That means that if that level is broken, we are looking at a potential 100-pt decline in the SPX. That would not be enough to put an end to the intermediate trend which started at 1075 unless, after a re-distribution level is formed, it becomes a possibility if the decline continues beyond 1159.
Let's not speculate, but take it one step at a time and concern ourselves first with the topping formation, and then with the ensuing decline. We'll start by analyzing the developing top formation on the Daily SPX Chart.
Chart analysis
Don't expect to see a potential 100-point top on this chart. It's the business of the P&F chart to show that. What we do see here, is a larger trend which started at the beginning of October (3-yr cycle low) from 1303, which is delineated by the purple channel lines, and which, as of last Thursday, was still making new highs.
Within that larger uptrend, there are several smaller ones, beginning with a spectacular four-week rally from 1203 to 1292 whose high was only bested last week - barely! Since then, the trend has been essentially sideways having, at best, a vague resemblance to an inversed Head & Shoulders pattern. If it is, we should only get a minor pull-back to the neckline (not shown) and then resume the uptrend. The SPX could also be making a broad consolidation pattern before moving higher.
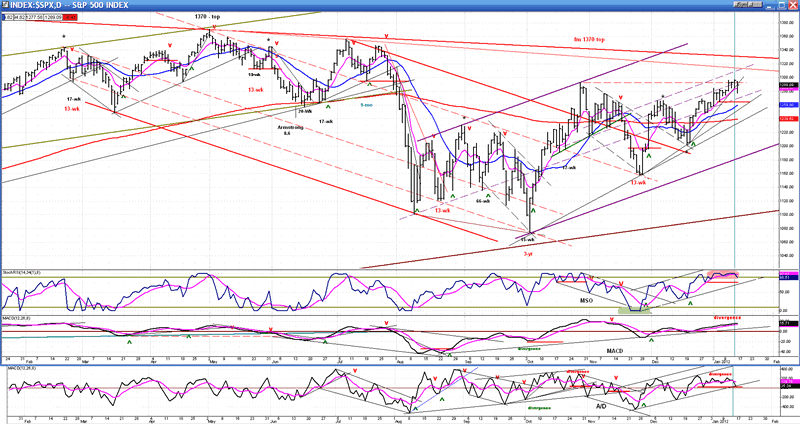
For now, the last short-term uptrend from 1203 appears to be coming to an end. If we turn to the indicators, we can see that the MSO has now been overbought for about two weeks, and that the MACD and the A/D are both showing negative divergence. More importantly, there has been a long-standing P&F projection of 1293-94 created by the base that formed above the 1203 level. This count was filled last week when the SPX moved to 1296. It tried to move beyond that level two more times in the course of the week, but could not and finally fell back on Friday.
Because the SPX has not yet given a sell signal, and because it formed a small re-accumulation level at 1277(which gives it a potential move to 1299), it is still possible that the index could move a little higher next week. As we will see next, the Hourly Chart indicators are also suggesting that this is possible.
What a beautiful short-term uptrend this is! From 1203, the SPX has moved up in a steady progression of higher highs and higher lows, within a well-defined channel which has yet to be violated. And yet, one could tell, almost from the start, that the extent of the move would be limited. Look at the MACD: from the very first top it started to show negative divergence, and this has become more and more pronounced as the trend moved higher. You can also see how price failed to get to the top of the channel a couple of weeks ago and was followed by a move sideways. For the first tie, on Friday, the SPX broke below the median and almost reached the bottom of the channel.
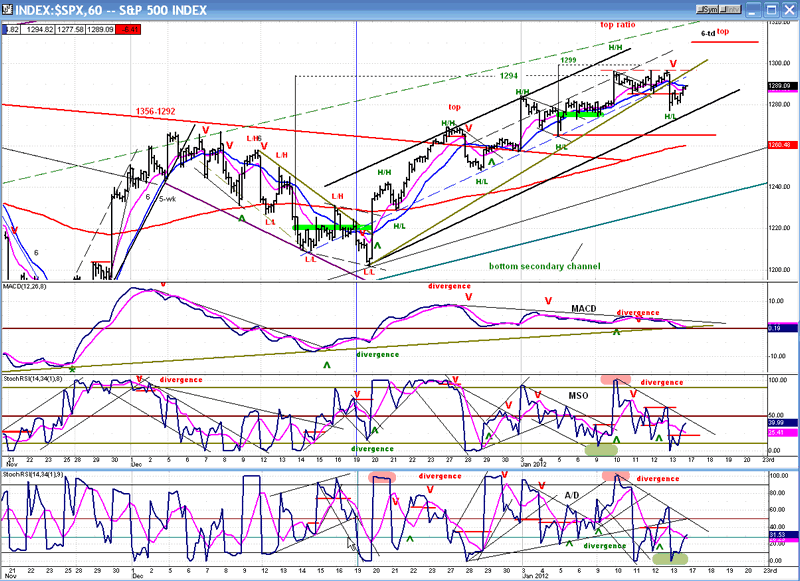
This loss of momentum is a negative but, according to the P&F, there is still a potential for going a little higher. And look at the indicators! They are oversold and trying to reverse. That puts the odds slightly in favor of re-testing last week's high, and perhaps even going a little higher.
Cycles
Next week is approximately six months from the July 2011 peaks and could bring about a high.
If we do have a reversal over the next few days, the downtrend could last until the first week in March when the next 15-wk cycle makes its low, along with two other important short-term cycles.
Breadth
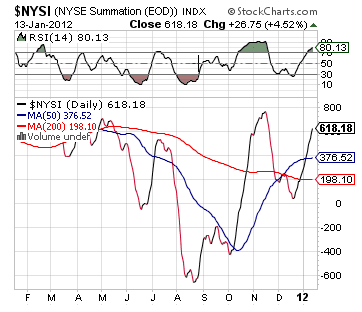
As expected, the Summation Index (courtesy StockCharts.com) has continued to move up until its RSI reached the overbought condition. Since both have not yet turned down, it's another reason to expect a little more from the SPX, either in time or price before it rolls over.
In spite of its current upside momentum, the NYSI is unlikely to make a new high, or even match its previous high. This would create negative divergence to the price, and could be a sign that the SPX is ready for a significant decline.
Sentiment
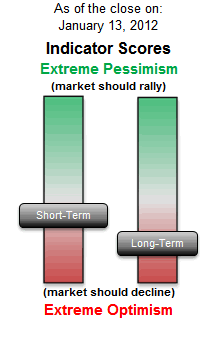
This is the lowest level that we have seen on the SentimenTrader (courtesy of same) long-term index since the SPX July top, which confirms expectations that we have arrived at an important market top.
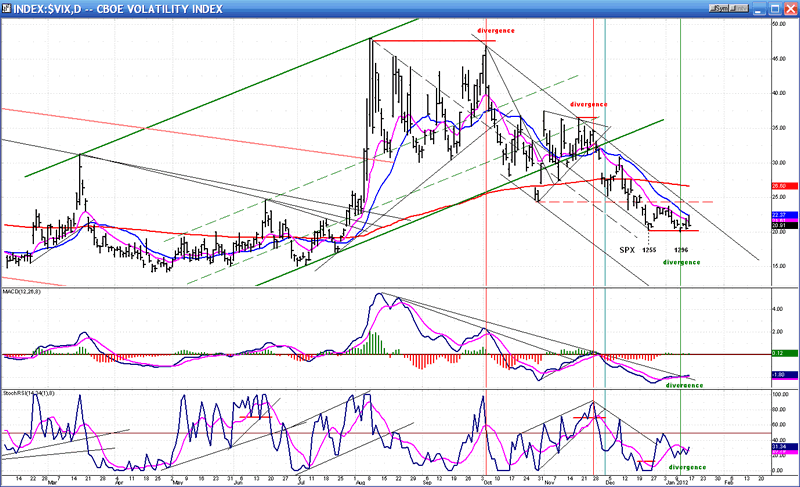
For the past few weeks, we have been looking at the weekly chart of the VIX. This week, we'll look at the Daily Chart instead, because positive divergence has appeared in the price as well as in the indicators -- something that we have not seen for a long time in the VIX -- and you know what that means: it's reversal time for the SPX! Even by itself, it would be a powerful enough signal, but combined with everything else that we have discussed so far, if you are a bull, you should start feeling a tad uncomfortable.
The positive divergence only shows up in the daily chart, not in the weekly chart. If our past study of the VIX behavior is valid, this should denote a short-term or intermediate-term reversal, not a major top. Besides, the VIX P&F chart is only forecasting a move to about 28 after which it should go through another phase of consolidation. The last important uptrend in the VIX started after a long basing period and went to 48. The current condition does not show any similarity and we should not be looking for a major decline in the SPX; nothing like the downtrend from 1370 to 1075. We will have a better idea of what to expect when the top pattern of the SPX is complete and we can make a P&F projection
BONDS
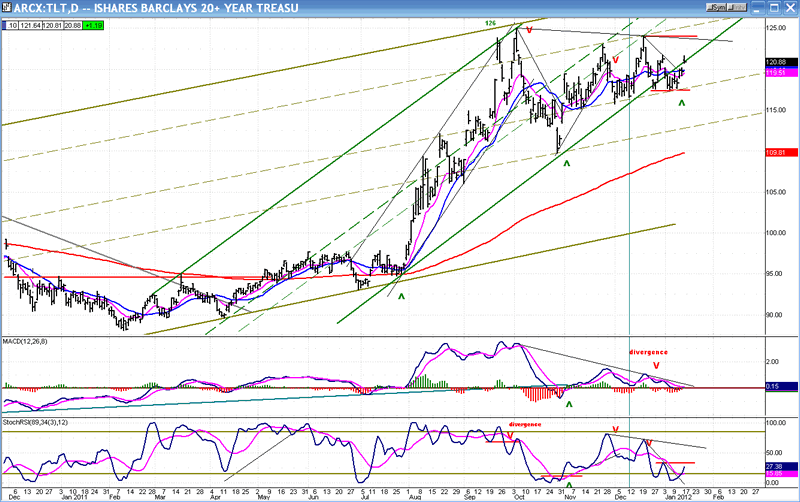
The week before last, TLT broke an important trend line, seemingly forecasting a trend reversal that could take it down to 110. But that was a devious maneuver meant to hide its true intentions which are to extend its uptrend, possibly to a new high.
Here is the TLT Daily Chart. Two price channels have been drawn: the more narrow one, which encompasses the uptrend from last February, and the wider one, which has its starting point in April 2010. While the long-term uptrend appears secure, the intermediate trend fooled us into thinking that it might be coming to an end two weeks ago when the index started to trade outside of its lower channel line. But there was no follow-through, and the similarity between the action of TLT and VIX over the past two weeks is suggesting a possible resumption of its uptrend.
This could result in a new high for TLT. What looked like distribution on the P&F chart now looks like re-accumulation instead with a potential for taking the price to 126-127.
The indicators have not yet given a conclusive buy signal, but they have started to reverse from an oversold position. This is a warning that the consolidation is probably over and that another uptrend is about to start. We'll give it a little more time to make sure!
UUP (Dollar ETF)
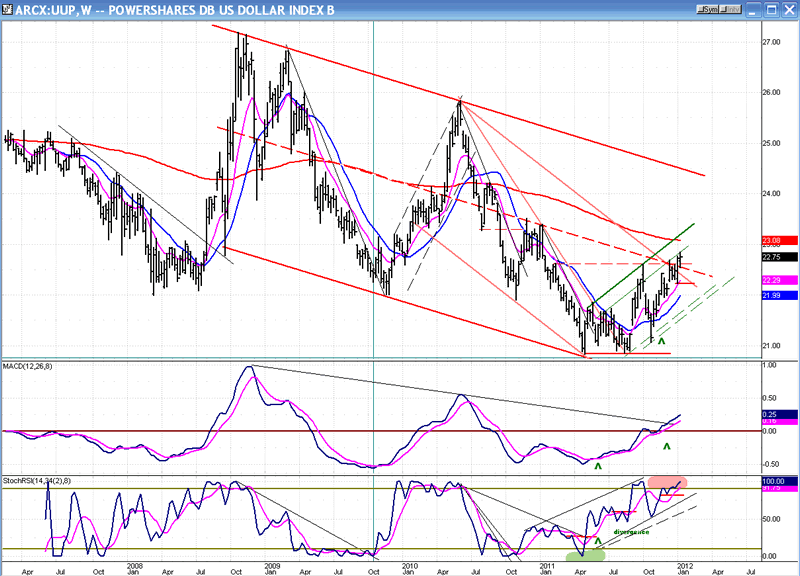
This week, we'll go back to analyzing the weekly chart of UUP where there is no equivocation about the direction of the trend. It's up! The price has just gone beyond a strong resistance area and made a new high. It has moved within an up channel since mid-August, and is getting ready to challenge its 200-wk MA. The indicators are also in a strong uptrend, even though the MSO is overbought. The MACD is particularly impressive, having just broken above a long-term trend line and continuing to move higher with no sign of deceleration.
The action of UUP appears to confirm what the US dollar P&F chart has been telling us. Between May and August 2011, the index created a base which is projecting a move to 90 (on Friday, the dollar closed at 81.51). There is an interim phase count to 83 which could result in a pause in its uptrend and give the SPX a chance to consolidate.
The dollar/UUP ratio remains fairly constant at about 3.58. When the dollar moves to 83, UUP should be at about 23.20, and at 90, UUP would be at about 25.10, slightly outside of its long-term channel.
GLD (ETF for gold)
The long-term trend in the SPX and in gold are not exact replicas, but they are more similar than not. If there is a noteworthy correction in the SPX, it could affect gold negatively. This confirms what we see when we analyze gold based on its own technical merits.
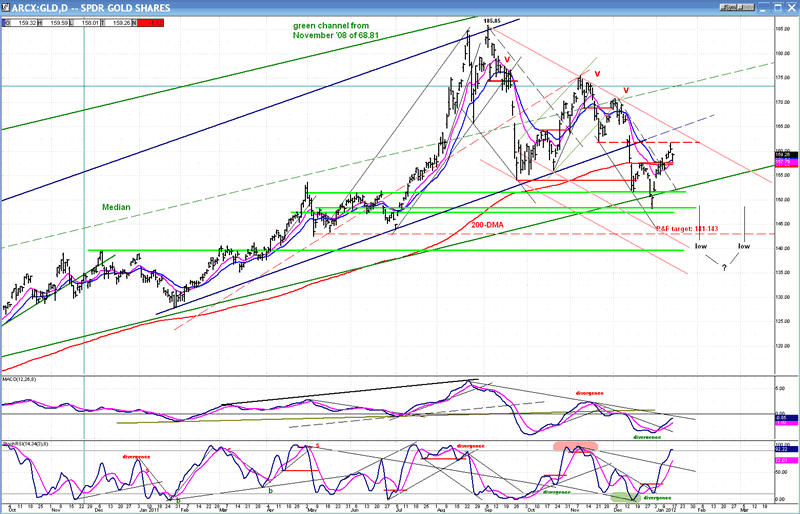
Analyzing GLD is the same as analyzing gold. GLD is currently in an intermediate downtrend which is incomplete. Although it has recently bounced from 148.27 to 161.62, it is still within the confines of its down-channel. As you can see on the chart, it found support on its long-term trend line from 2008, as well as from a former congestion level created between May and July 2011.
After it made its high of 185.85, the P&F chart created a projection down to a minimum of 143-144 with a maximum of 134. The re-distribution level that formed around 170 confirmed these initial projections. GLD did not initially make it down to its P&F projections because of the support levels mentioned above. But it is very likely that there will be another attempt at meeting these targets before the index is ready to resume its long-term uptrend.
It is unlikely that gold has reached it final high. From the re-accumulation level which occurred between March 2008 and August 2009, we could derive two distinct projections: a minimum move to about 187-189 (the high came near 186), and a maximum move to 233. Therefore, when the intermediate correction is over, GLD should be able to proceed to the higher projection.
Before it is ready to do that, the following should take place:
1 - GLD should, at least, meet its downside target of 143, and perhaps of 134 as well.
2 -- When an intermediate correction occurs, the initial uptrend usually resets to a lesser angle of ascent. By holding on to the long-term trend line, this did not take place. However, moving down to 143-134 would do the trick.
3 - On the P&F chart, the correction should create a re-accumulation base which is substantial enough to give a confirming count to the next higher projection of 233. This has not been done, and could take a while.
For these reasons, the odds are that GLD needs more work in time and price before its correction is complete.
Summary
There is a virtual fanfare of warning signs heralding the arrival of a (perhaps significant) top for the SPX and other equity indices. How significant is a question that we will have to let the market answer in due time.
When the top is complete (perhaps by the end of next week) the P&F chart should give us an estimate of the decline's extent.
FREE TRIAL SUBSCRIPTON
If precision in market timing for all time frames is something which is important to you, you should consider a trial subscription to my service. It is free, and you will have four weeks to evaluate its worth.
For a FREE 4-week trial. Send an email to: ajg@cybertrails.com
For further subscription options, payment plans, and for important general information, I encourage you to visit my website at www.marketurningpoints.com. It contains summaries of my background, my investment and trading strategies and my unique method of intra-day communication with Market Turning Points subscribers.
By Andre Gratian
MarketTurningPoints.com
A market advisory service should be evaluated on the basis of its forecasting accuracy and cost. At $25.00 per month, this service is probably the best all-around value. Two areas of analysis that are unmatched anywhere else -- cycles (from 2.5-wk to 18-years and longer) and accurate, coordinated Point & Figure and Fibonacci projections -- are combined with other methodologies to bring you weekly reports and frequent daily updates.
“By the Law of Periodical Repetition, everything which has happened once must happen again, and again, and again -- and not capriciously, but at regular periods, and each thing in its own period, not another’s, and each obeying its own law … The same Nature which delights in periodical repetition in the sky is the Nature which orders the affairs of the earth. Let us not underrate the value of that hint.” -- Mark Twain
You may also want to visit the Market Turning Points website to familiarize yourself with my philosophy and strategy.www.marketurningpoints.com
Disclaimer - The above comments about the financial markets are based purely on what I consider to be sound technical analysis principles uncompromised by fundamental considerations. They represent my own opinion and are not meant to be construed as trading or investment advice, but are offered as an analytical point of view which might be of interest to those who follow stock market cycles and technical analysis.
Andre Gratian Archive |
© 2005-2022 http://www.MarketOracle.co.uk - The Market Oracle is a FREE Daily Financial Markets Analysis & Forecasting online publication.