


Dow Stock Market Index History: Where Are We Now?
Stock-Markets / Stock Markets 2012 Jan 17, 2012 - 11:17 AM GMTBy: PhilStockWorld

 Courtesy of Doug Short. Advisor Perspectives welcomes guest contributions. The views presented here do not necessarily represent those of Advisor Perspectives.
Following on from my overall summary chart of 110 years of the Dow Jones Industrial Average (DJIA) published here last week, further detailed analysis serves to demonstrate that volatility has been reliably consistent for the past 110 years, and now is no different.
Leading on from last week’s DJIA summary, I discovered on the 10base LOG chart that there was an approximate 16.6 year bounding box with 43% depth that could be repeatedly applied throughout the entire DJIA price history ? stacked vertically and added horizontally. I have since discovered this was no accident, and the chart below shows you how it was derived, in both time and price.
The completed annotated DJIA chart ? (using LOG based quartiles)
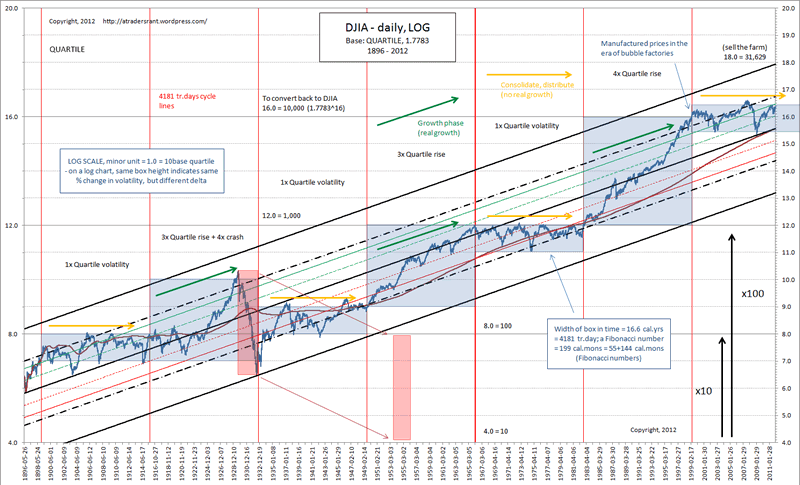
Notations show alternating periods, highlighted volatility, and the amount of growth in quartile boxes (in blue). A similar chart can be done using a quintile LOG chart, but the repeating range is predominantly in quartiles.
After a bit of Photoshop pasting with an overlay of D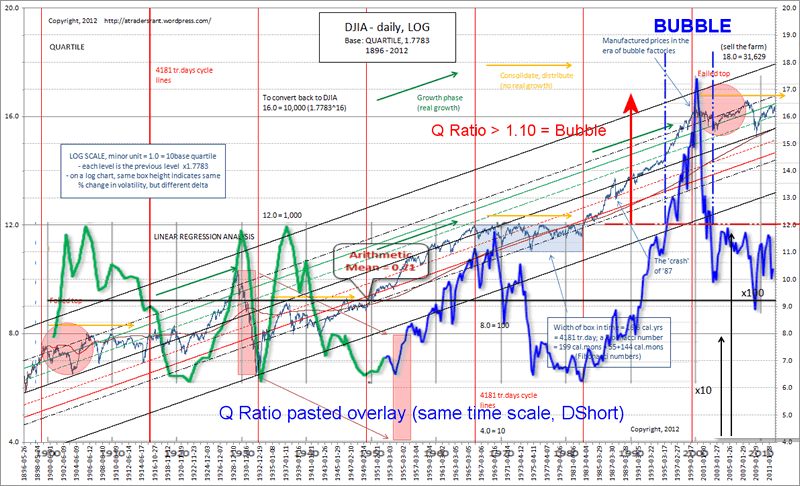 oug Short’s Q Ratio analysis (sourced here), we get this interesting result.
The chart above shows that the previous growth cycles have all commenced on a Q Ratio low, as it did in 1983, and would also be timed similarly for lows in other market value ratios such as cyclical P/E ratios, etc. It further confirms the current level of the Q Ratio, after the growth period into 2000, is yet to reach anywhere near the low levels of the three previous consolidation periods.
Where do I think we are now?
As of January 2000, we had just completed another ten-fold increase in the DJIA index, as a result of a clear up-leg with excess rate of growth that was almost 3% steeper that the growth out of the 1932 low. This has ended in what appears to be a failed top similar to 1900-1910. So it stands to reason that we are in another sideways consolidation period. Using the 4181 cycle lines, the current cycle period expires approximately October 2015. The rise that has occurred during the previous cycle is the steepest sustained move in the DJIA history analyzed.
One century after the 1900′s, it now seems obvious that we are heading back into the equivalent of 1930. The 20th century completed a large expansionary phase of historic technological advance on the back of the industrial revolution of the 19th century. Unfortunately we are now in the stronghold of rampant monetary stupidity, feeding banks with mindless public capital with a net result of simply blowing bubbles. Just as the early 1900′s were to the 1800′s, so too is this phase of the 21st century to the century past. Nothing has changed.
We are essentially in the 21st century version of 1910 heading into 2030 d?j? vu all over again. As per the chart below…
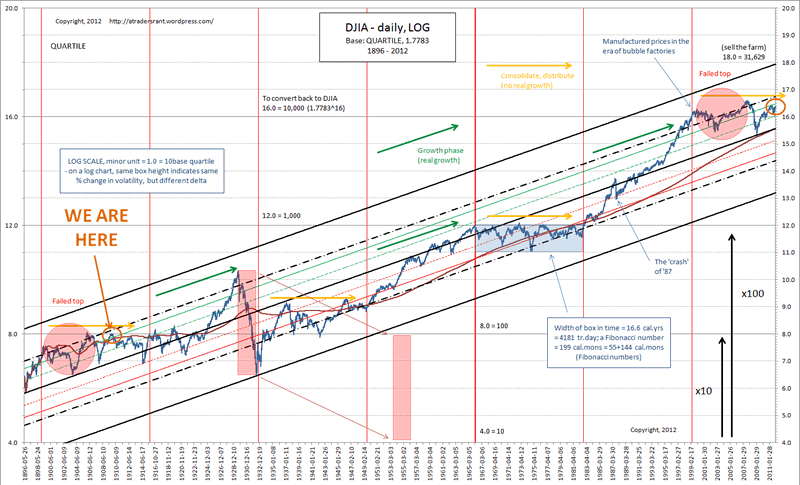
…one hundred years later, do we find ourselves back in the same spot?
Note from dshort: For a more detailed discusion of the calculation methods in the log charts above, see the expanded version here.
(c) Peter Williams
http://atradersrant.wordpress.com
- Phil
Philip R. Davis is a founder of Phil's Stock World (www.philstockworld.com), a stock and options trading site that teaches the art of options trading to newcomers and devises advanced strategies for expert traders. Mr. Davis is a serial entrepreneur, having founded software company Accu-Title, a real estate title insurance software solution, and is also the President of the Delphi Consulting Corp., an M&A consulting firm that helps large and small companies obtain funding and close deals. He was also the founder of Accu-Search, a property data corporation that was sold to DataTrace in 2004 and Personality Plus, a precursor to eHarmony.com. Phil was a former editor of a UMass/Amherst humor magazine and it shows in his writing -- which is filled with colorful commentary along with very specific ideas on stock option purchases (Phil rarely holds actual stocks). Visit: Phil's Stock World (www.philstockworld.com)
© 2012 Copyright PhilStockWorld - All Rights Reserved Disclaimer: The above is a matter of opinion provided for general information purposes only and is not intended as investment advice. Information and analysis above are derived from sources and utilising methods believed to be reliable, but we cannot accept responsibility for any losses you may incur as a result of this analysis. Individuals should consult with their personal financial advisors.
© 2005-2022 http://www.MarketOracle.co.uk - The Market Oracle is a FREE Daily Financial Markets Analysis & Forecasting online publication.