UK Recession 2012 Certain as Bank of England Prepares to Ramp Up Money Printing Presses
Economics / Recession 2012 Jan 25, 2012 - 11:33 AM GMTBy: Nadeem_Walayat

 The UK Economy was thrown into reverse gear in the final quarter of 2011 by contracting by GDP 0.2%, which may not sound like much but this does send a shock wave warning through the economy that a second recession is now near certain to be declared in April 2012 as measured by 2 consecutive quarters of GDP contraction.
 The oft heralded Manufacturing sector as the savior of the British economy was hit the hardest which contracted by -0.9%, with Construction hard on its heels down by -0.5% and many service sectors also contracting by -0.5%. Meanwhile the much hyped of government spending cuts and economic austerity was shown to be bogus as I have oft warned that it would be as the unproductive Government sector expanded by 0.4%.
Any negative GDP number for Q4 2011, even if it is relatively small number of just 0.2% still means a recession is a near certainty on release of 2012 Q1 data in April 2012 as Britain's largest trading partner, the Euro-zone is tipping into something far worse with signs of another full blown economic depression as a consequence of the failure to resolve the fundamental structural flaw at the heart of the Eurozone, which is that no country can compete against Germany, this all are destined to be destroyed by means of expanding deficit driven debt mountains unless they are able to devalue their currencies which they cannot do because they don't have their own currencies anymore, so debt default starting with Greece is inevitable for all, including France unless this fundamental flaw in the construct of the Eurozone is addressed. Instead a deflationary death spiral for all except Germany is the order of the day.
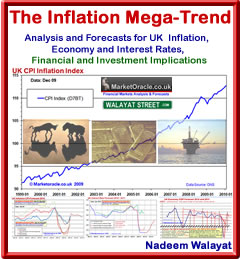
Whilst the latest UK GDP data has stimulated much speculation in the mainstream press of fears of Recession induced Deflation in the UK, despite the undeniable fact as evidenced by the inflation data of the past 2 years that there is no Deflation for Britain, Instead the UK is in the grips of an Inflationary Depression as warned of in the Inflation Mega-trend ebook of Jan 2010 (FREE DOWNLOAD), that looks set to continue for the whole decade.
So, all of the solutions that will be espoused by academics for the likes of the Bank of England to implement form printing money electronically by means of further Quantitative Easing to the Government scaling back on austerity and what are already inept deficit reduction policies, all sows the seed of further feeding the fires of the already raging Inflation mega-trend that seriously risks sparking a debt interest inflationary spiral as market interest rates for Government bonds start to rise towards where the likes of much of the Eurozone are at, which will only be financed by further rounds of money printing as warned of over 2 years ago in December 2009 (03 Dec 2009 - Britain's Inflationary Debt Spiral as Bank of England Keeps Expanding Quantitative Easing), which is more or less what sis coming to pass as the Bank of England has magic mushroomed £275 billion into existence to buy government debt via the bankrupt banks, now look set for another £100billion print run during the first 6 months of 2012.
The Debt bottom line is that whilst the mainstream press focuses on official debt (PSND) that this week passed £1 trillion, total public and private debt plus banking and public sector liabilities are actually about TEN TIMES higher at about £10 trillion, which is why the only answer the government has is to INFLATE debt away, as a real inflation rate of 6% equates to inflating away a huge £600 billion of public and private debt.
As things stand it does not take a genius to conclude that the UK Recession of 2012 will likely extend to at least Mid 2012, so now looks destined to run for 3 consecutive quarters that accumulatively could contract by about 1% over 3 quarters, by which time we will know how effective subsequent Bank of England and Government measures have been to inflate the economy for the balance of the year. A more precise forecast will follow in an in-depth analysis of the UK economy, but as things stand a positive end to 2012 is now looking a tough ask, which is set against the Governments economic propaganda agency OBR forecast UK GDP for 2012 of 2.5% (March 2011).
The academics economists repetitive response is - How can there continue to be inflation when the economy is contracting and when wages are falling in real terms, surely inflation cannot continue? Despite the fact that this is the same losing argument that has been pumped out by academics right form the Bank of England downwards for the past 2 years where Debt deleveraging deflation economic theory has FAILED to match economic reality of rising inflation as illustrated by the below inflation graph.
The answer to why the inflation mega-trend looks set to continue for the whole decade despite all of the academic economic reasons of why it should not even exist will be set forth in my next in depth analysis. Ensure you are subscribed to my always free newsletter to get this literally several years ahead of curve analysis on the NEXT MEGA-TREND in your email in box.
Source and Comments: http://www.marketoracle.co.uk/Article32811.html
By Nadeem Walayat
Copyright © 2005-2012 Marketoracle.co.uk (Market Oracle Ltd). All rights reserved.
Nadeem Walayat has over 25 years experience of trading derivatives, portfolio management and analysing the financial markets, including one of few who both anticipated and Beat the 1987 Crash. Nadeem's forward looking analysis focuses on UK inflation, economy, interest rates and housing market. He is the author of three ebook's - The Inflation Mega-Trend; The Interest Rate Mega-Trend and The Stocks Stealth Bull Market Update 2011 that can be downloaded for Free.
Nadeem is the Editor of The Market Oracle, a FREE Daily Financial Markets Analysis & Forecasting online publication that presents in-depth analysis from over 600 experienced analysts on a range of views of the probable direction of the financial markets, thus enabling our readers to arrive at an informed opinion on future market direction. http://www.marketoracle.co.uk
Disclaimer: The above is a matter of opinion provided for general information purposes only and is not intended as investment advice. Information and analysis above are derived from sources and utilising methods believed to be reliable, but we cannot accept responsibility for any trading losses you may incur as a result of this analysis. Individuals should consult with their personal financial advisors before engaging in any trading activities.
Nadeem Walayat Archive |
© 2005-2022 http://www.MarketOracle.co.uk - The Market Oracle is a FREE Daily Financial Markets Analysis & Forecasting online publication.
Comments
|
Kelvin
26 Jan 12, 06:35 |
DOW
Nadeem, Another good article. I noticed (previously) that you expected new DOW highs by the end of last year. Do you think new DOW highs will be formed in January/February, or are you selling into this rally as you suggested once? Do you still envisage a sell off due to europe? I'm not sure what your position on this is now. Best, Kelvin |
|
Nadeem_Walayat
26 Jan 12, 06:55 |
Stock Market Grinding towards New Bull Market High
Hi My expectations were / are for the Dow to put in a new bull market high this month - 18 Dec 2011 - Euro Collapse Crisis Sledgehammer Pounds Into Stock Market Santa Rally
I eagerly await the new bull market high which appears imminent, and yes I have been selling into it. Though remember during the summer correction when the Dow was a good 20% lower I had put myself at my most long that I have ever been, so that's a lot of risk I to carry into an uncertain 2012, my aim is to least half that risk, which I am in the process of doing. But do not confuse this with being bearish, yes 2012 will be volatile but if the market fell say 25% right now, I would be buying ! My next indepth analysis should prove illuminating into what is likely to unfold over the next few years for all assets. Best NW |
|
Kelvin
28 Jan 12, 06:31 |
Imminent correction?
Nadeem, Do you expect 25% falls? Now that the DOW is approaching new bull market highs (not historic highs), do you expect a significant correction, or do you still believe the DOW is in an impulse wave 3. I ask because of the negative weekly and daily divergence with the DOW currently and because the FTSE and some commodity stocks have made quite significant head and shoulders. What is you quick take on this. If you believe the DOW is going higher over the next six months, do you have an approximate target in mind? Thank you for your thoughts. Kelvin |
|
Kelvin
29 Jan 12, 03:46 |
Help
Hi Nadeem, Sorry to sound a bit confusing above. Just not 100% sure what you mean. Would it be possible if you could give a very brief analysis of what levels you think the DOW will reach over the next six months. Just a rought estimate. For example; are you expecting the DOW to reach the 14,000's at the end of impulse wave 5, or are you thinking there will be a significant sell off before because of europe and/or Greece defaulting? Price action seems to suggest a number of important break outs (e.g. copper, gold, silver etc.) so my gut feeling is to still be buying right now (Gann, "commodities"). Should we just be ignoring the news/european events and just trade the price? It worried me before as I respect your analsis and thought you were selling a number of positions in anticipation of perhaps a black swan event? Thank you again. Kelvin |
|
Nadeem_Walayat
29 Jan 12, 07:07 |
Rescue on its way
Hi We are in a bull market in stocks, remember that, the greater the deviation from the high the greater the buying opportunity. We have had a great run higher over the last 6 months of over 23%! My strategy is simple, not complicated, the greater the fall the more I buy which is why I was at my most long ever during the depths of the summer crisis. As I wrote over a month ago, I would be reducing my exposure by about half to stocks on an expected rally to new bull market highs durign Janaury 2012, thats not the same as becoming a bear. The stock market ups and downs are just volatiltiy in a BULL market, will we see 14k in 2012 ? I don't know yet, but it does look likely to be pretty volatile. Best NW |
|
Kelvin
02 Feb 12, 06:23 |
Help
Thanks Nadeem. Very helpful. Looking forward to your next analysis. It's great to read something refreshing once and a while. K |
|
Kelvin
05 Feb 12, 03:37 |
One last question
I see the DOW has now closed with new bull market highs. However, I also see a number of head and shoulder patterns (e.g. FTSE 100, RIO, BLT) on daily/weekly. Is this anything to be concerned about, or do you expect further gains near term? Some of the leading FTSE stocks were not making large gains on Friday - often an indication something is wrong. Is eur/usd going to 1.35/1.36 or resuming longer term downtrend imminently? This sold off with gold as DOW was making new bull highs on Friday. Again, is this a warning signal? Gold failed to make new monthly highs (Dec 2011), despite positive manipulated US data on Friday. Is this a leading indicator of more pain to come along with Baltic Dry Index? Is DOW still in wave 3, or about to enter wave 4 (Elliott), or is something else going on (abc correction/upward diagonal channel indicating the possibility of a major fall)? Many contrary signals. Can you help with the navigation over the next six months? Thanks Nadeem. |
|
James
10 Feb 12, 07:18 |
Indices
Hello Nadeem, On a technical basis, where do you see FTSE 100 and DOW going during 2012? Are we witnessing currently a mild correction, or something much bigger? Would be grateful for your thoughts. James |