


U.S. Non Farm Payrolls Interesting Market Divergences
Stock-Markets / Financial Markets 2012 Feb 04, 2012 - 09:00 AM GMTBy: Capital3X

 NFP printed 243K, higher than forecast. As expected markets took out all resistance's and moved to the almighty important level of 1345/50.
Key highlights from NFP report
- Total nonfarm payroll employment rose by 243,000 in January. Private-sector employment grew by 257,000, with the largest employment gains in professional and business services, leisure and hospitality, and manufacturing. Government employment was little changed over the month. (See table B-1.)
- Professional and business services continued to add jobs in January (+70,000). About half of the increase occurred in employment services (+33,000). Job gains also occurred in accounting and bookkeeping (+13,000) and in architectural and engineering services (+7,000).
- Over the month, employment in leisure and hospitality increased by 44,000, primarily in food services and drinking places (+33,000). Since a recent low in February 2010, food services has added 487,000 jobs.
- In January, health care employment continued to grow (+31,000). Within the industry, hospitals and ambulatory care services each added 13,000 jobs.
- Wholesale trade employment increased by 14,000 over the month. Since a recent employment low in May 2010, wholesale trade has added 144,000 jobs.
- Employment in retail trade continued to trend up in January. Job gains in department stores (+19,000), health and personal care stores (+7,000), and automobile dealers (+7,000) were partially offset by losses in clothing and clothing accessory stores (-14,000). Since an employment trough in December 2009, retail trade has added 390,000 jobs.
- In January, employment in information declined by 13,000, including a loss of 8,000 jobs in the motion picture and sound recording industry.
- In the goods-producing sector, manufacturing added 50,000 jobs. Nearly all of the increase occurred in durable goods manufacturing, with job growth in fabricated metal products (+11,000), machinery (+11,000), and motor vehicles and parts (+8,000). Durable goods manufacturing has added 418,000 jobs over the past 2 years.
- Employment in construction increased by 21,000 in January, following a gain of 31,000 in the previous month. Over the past 2 months, nonresidential specialty trade contractors added 30,000 jobs.
- Mining added 10,000 jobs in January, with most of the gain in support activities for mining (+8,000). Since a recent low in October 2009, mining employment has expanded by 172,000.
- Government employment changed little in January. Over the past 12 months, the sector has lost 276,000 jobs, with declines in local government; state government, excluding education; and the U.S. Postal Service.
- The average workweek for all employees on private nonfarm payrolls was unchanged in January. The manufacturing workweek increased by 0.3 hour to 40.9 hours, and factory overtime increased by 0.1 hour to 3.4 hours. The average workweek for production and nonsupervisory employees on private nonfarm payrolls edged up by 0.1 hour to 33.8 hours. (See tables B-2 and B-7.)
Well into the NY session, we chart a few setups and quite clearly there are some interesting divergences which have become even more pronounced after todays moves.
NY Session charts
Dollar Index Charts

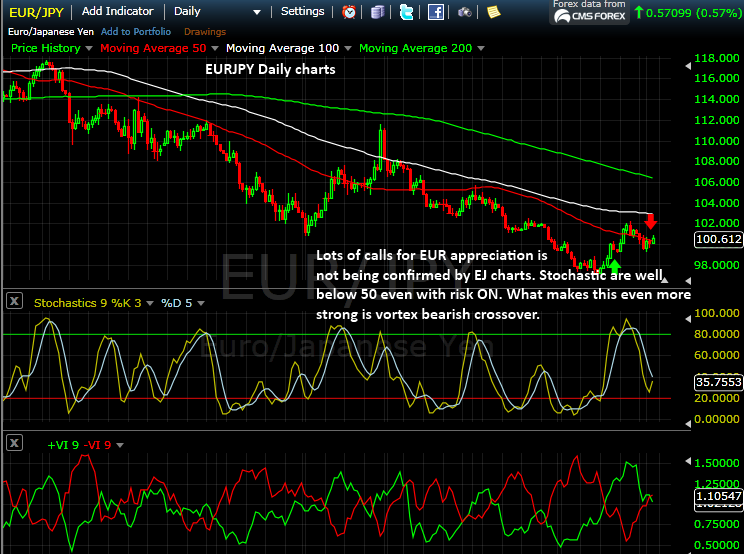
EJ Charts
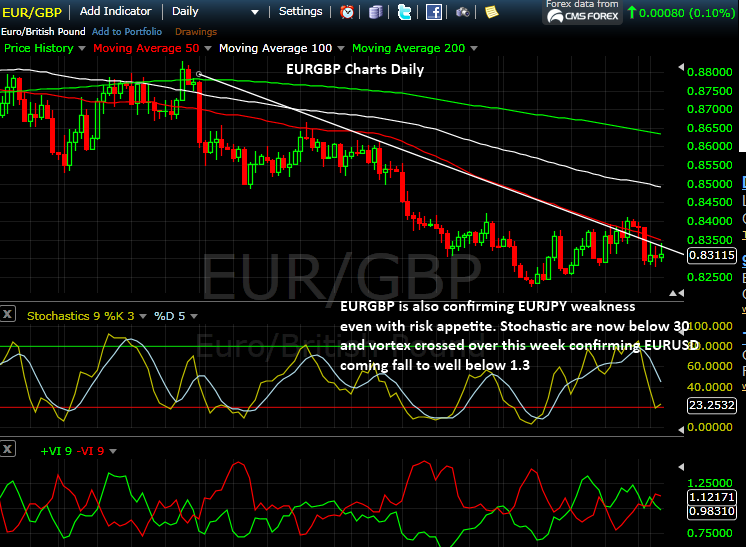
EURGBP Charts

AUD/JPY Charts
Some more macro data and analysis
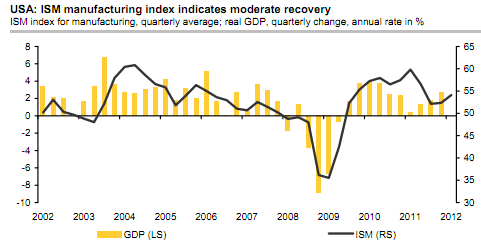
The ISM index for manufacturing increased to 54.1 in January from a downwardly revised 53.1 (originally reported as 53.9) that reflects new seasonal factors. This level is the highest since June and consistent with a moderate expansion. The consensus was a gain to 54.5. The increase parallels the positive trend in other manufacturing surveys. Only the Chicago PMI decreased in January, but from an exceptionally high level. Details were somewhat mixed: Production declined 3.2 to a still-high 55.7, possibly on the phasing out of incentives for capital expense items at the end of 2011. The forward-looking new orders component gained 2.8 to 57.6, the highest since April. The employment sub-index slipped 0.5 to 54.3. Outside the components of the headline index, new export orders were up another 2.0 to 55.0. The solid increase in foreign demand puts fears about negative spillovers from the global economy into perspective. Also on the positive side, the backlog of orders index increased 4.5 to 52.5, indicating a greater backlog for the first time since May. On the other hand, the indices on both own inventories and customers’ inventories increased in January, reflecting the recent build-up in stockpiles which may damp future production. In sum, the report indicates that the manufacturing sector continues to improve, consistent with a moderate expansion of the overall US economy (chart).
To close out this part premium analysis from C3X, we do a quick review of EU situation.
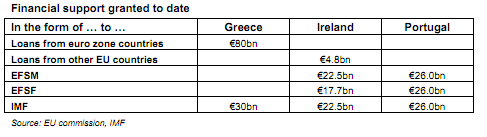
Bilateral loans
Euro zone countries have granted bilateral loans to Greece in an amount of €80bn, of which €53bn have been disbursed to date. The UK (€3.8bn), Sweden (€0.6bn) and Denmark (€0.4bn) also participated with loans in Ireland’s rescue.EFSF (European Financial Stability Facility)
The EFSF is equipped with guarantees of €780bn provided by the euro zone countries according to their respective shares of the ECB’s capital and can extend loans up to€440bn. The EFSF has various instruments at its disposal to support euro zone countries in financial difficulties: loans, purchases of government bonds on the primary and secondary markets, insurance of government bonds.EFSM (European Financial Stability Mechanism)
To provide financial assistance, the EU Commission can raise up to €60bn on the capital market. The EFSM’s debt is backed by the EU budget. The EFSM has approved loans in an amount of €48.5bn to date.ELA (Emergency Liquidity Assistance)
As lenders of last resort, national central banks in the euro zone can grant loans to commercial banks to prevent contagion risks following a financial shock. Little official information is available about ELA loans. The Irish central bank has borrowed nearly €50bn in 2010. The Greek central bank granted ELA loans in August 2011 but did not mention an amount.ESM (European Stability Mechanism)
The ESM shall enter into force on 1 July 2012, replacing both the EFSM and the EFSF. The option to continue the EFSF for some time alongside the ESM is currently under discussion. The ESM has an equity capital of €80bn to be paid in by the euro zone countries and another €620bn in callable funds. The ESM can extend loans up to €500 bn. The adequacy
of resources under the EFSF and ESM rescue funds will be reassessed in March. The ESM will have the same instruments at its disposal as the EFSF.IMF SBA (Stand-By Arrangement)
The funds the IMF were provided under Stand-by and Extended Arrangement. These loans carry comparatively low interest rates.
Purchase programme for covered bonds
Under a first programme, national central banks in the euro zone bought covered bonds to the tune of some €60bn between July 2009 and June 2010. A second programme with a volume of €40bn running until October 2012 has been in place since November 2011. Some €5.5bn of this volume have been realised since then.SMP (Securities Markets Programme)
On 9 May 2010, the ECB Council established a purchase programme for public and private debt instruments. To date, national central banks in the euro zone have bought nearly €220bn in government bonds from euro zone countries in crisis on the market.We continue to watch the price action and will update our premium subscribers with new analysis and charts. Our trade portfolio (Forex, SPX Emini, Crude, Gold, Silver) is visible to our premium subscribers
Our feeds: RSS feed
Our Twitter: Follow UsKate
Capital3x.com
Kate, trading experience with PIMCO, now manage capital3x.com. Check performance before you subscribe.© 2012 Copyright Capital3X - All Rights Reserved
Disclaimer: The above is a matter of opinion provided for general information purposes only and is not intended as investment advice. Information and analysis above are derived from sources and utilising methods believed to be reliable, but we cannot accept responsibility for any losses you may incur as a result of this analysis. Individuals should consult with their personal financial advisors.
© 2005-2022 http://www.MarketOracle.co.uk - The Market Oracle is a FREE Daily Financial Markets Analysis & Forecasting online publication.