Most Popular
1. It’s a New Macro, the Gold Market Knows It, But Dead Men Walking Do Not (yet)- Gary_Tanashian
2.Stock Market Presidential Election Cycle Seasonal Trend Analysis - Nadeem_Walayat
3. Bitcoin S&P Pattern - Nadeem_Walayat
4.Nvidia Blow Off Top - Flying High like the Phoenix too Close to the Sun - Nadeem_Walayat
4.U.S. financial market’s “Weimar phase” impact to your fiat and digital assets - Raymond_Matison
5. How to Profit from the Global Warming ClImate Change Mega Death Trend - Part1 - Nadeem_Walayat
7.Bitcoin Gravy Train Trend Forecast 2024 - - Nadeem_Walayat
8.The Bond Trade and Interest Rates - Nadeem_Walayat
9.It’s Easy to Scream Stocks Bubble! - Stephen_McBride
10.Fed’s Next Intertest Rate Move might not align with popular consensus - Richard_Mills
Last 7 days
Friday Stock Market CRASH Following Israel Attack on Iranian Nuclear Facilities - 19th Apr 24
All Measures to Combat Global Warming Are Smoke and Mirrors! - 18th Apr 24
Cisco Then vs. Nvidia Now - 18th Apr 24
Is the Biden Administration Trying To Destroy the Dollar? - 18th Apr 24
S&P Stock Market Trend Forecast to Dec 2024 - 16th Apr 24
No Deposit Bonuses: Boost Your Finances - 16th Apr 24
Global Warming ClImate Change Mega Death Trend - 8th Apr 24
Gold Is Rallying Again, But Silver Could Get REALLY Interesting - 8th Apr 24
Media Elite Belittle Inflation Struggles of Ordinary Americans - 8th Apr 24
Profit from the Roaring AI 2020's Tech Stocks Economic Boom - 8th Apr 24
Stock Market Election Year Five Nights at Freddy's - 7th Apr 24
It’s a New Macro, the Gold Market Knows It, But Dead Men Walking Do Not (yet)- 7th Apr 24
AI Revolution and NVDA: Why Tough Going May Be Ahead - 7th Apr 24
Hidden cost of US homeownership just saw its biggest spike in 5 years - 7th Apr 24
What Happens To Gold Price If The Fed Doesn’t Cut Rates? - 7th Apr 24
The Fed is becoming increasingly divided on interest rates - 7th Apr 24
The Evils of Paper Money Have no End - 7th Apr 24
Stock Market Presidential Election Cycle Seasonal Trend Analysis - 3rd Apr 24
Stock Market Presidential Election Cycle Seasonal Trend - 2nd Apr 24
Dow Stock Market Annual Percent Change Analysis 2024 - 2nd Apr 24
Bitcoin S&P Pattern - 31st Mar 24
S&P Stock Market Correlating Seasonal Swings - 31st Mar 24
S&P SEASONAL ANALYSIS - 31st Mar 24
Here's a Dirty Little Secret: Federal Reserve Monetary Policy Is Still Loose - 31st Mar 24
Tandem Chairman Paul Pester on Fintech, AI, and the Future of Banking in the UK - 31st Mar 24
Stock Market Volatility (VIX) - 25th Mar 24
Stock Market Investor Sentiment - 25th Mar 24
The Federal Reserve Didn't Do Anything But It Had Plenty to Say - 25th Mar 24

Market Oracle FREE Newsletter

How to Protect your Wealth by Investing in AI Tech Stocks

Silver Price Could Challenge $50

Commodities / Gold and Silver 2012 Feb 24, 2012 - 08:17 AM GMT

By: Hubert_Moolman

Commodities

Best Financial Markets Analysis ArticleSilver is currently trading at key resistance levels. See below, a six-year silver chart (all charts generated at fxstreet.com):


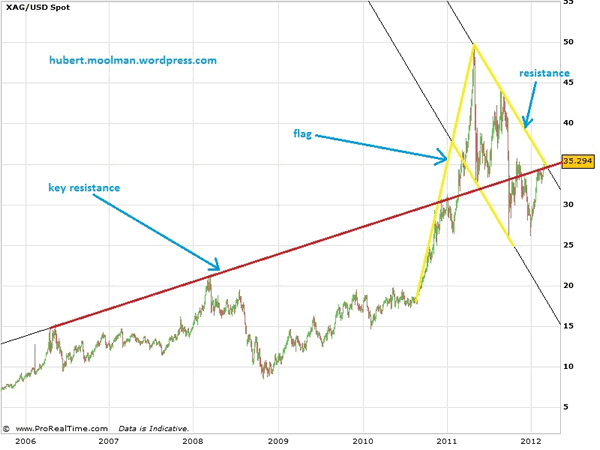
On the chart, I have drawn a significant upward sloping resistance line (red line). Silver has now reached that line, trying to breach it and stay above it. It has also reached the top resistance line of a big flag pattern. If the silver price gets through these resistance lines, and stays above them, then it is likely to continue its rise, but likely in a more accelerated manner.

These resistance areas can be very tricky. Price can often react in a violent manner downwards; however, there are no certainties.

What silver will do at these resistance areas is a short-term problem. From a longer point of view, it is clear to me that silver is going much higher. Eventually, it will successfully break out of the big flag and spike upwards past the $50 level.

In a previous article, I have shown how closely silver is following a past pattern on the gold chart. That comparison also suggests that the silver price will eventually successfully breach the resistance lines indicated above. Below, is the chart from that comparison:

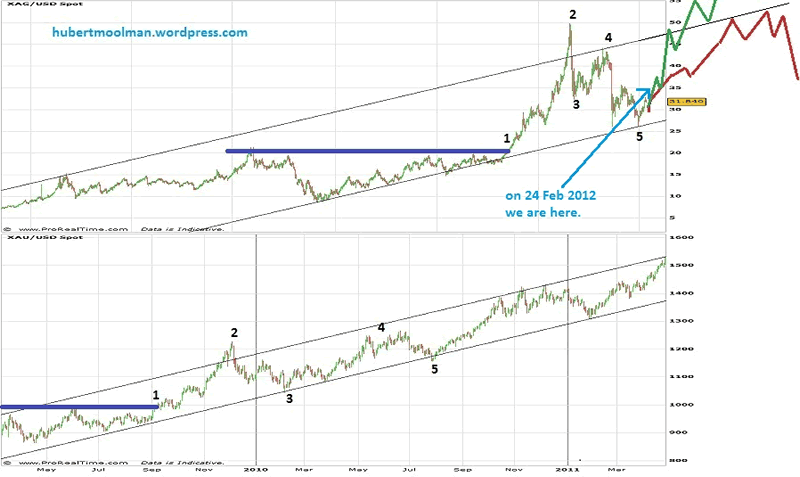
On the charts (silver is the top one and gold is the bottom one), I have marked the two patterns (1 to 5) that are similar on the gold and silver chart. For more details and explanation of the two patterns, please read that full article. If the silver pattern continues to follow the gold pattern, then the silver price would pass the resistance lines indicated in the first chart, and eventually challenge the $50 level.

"And it shall come to pass, that whosoever shall call on the name of the Lord shall be saved"

For more detailed analysis of gold, silver and the Dow, you are welcome to subscribe to my free or premium service.

Warm regards and God bless,

Hubert

http://hubertmoolman.wordpress.com/

You can email any comments to hubert@hgmandassociates.co.za

© 2012 Copyright Hubert Moolman - All Rights Reserved

Disclaimer: The above is a matter of opinion provided for general information purposes only and is not intended as investment advice. Information and analysis above are derived from sources and utilising methods believed to be reliable, but we cannot accept responsibility for any losses you may incur as a result of this analysis. Individuals should consult with their personal financial advisors.


© 2005-2022 http://www.MarketOracle.co.uk - The Market Oracle is a FREE Daily Financial Markets Analysis & Forecasting online publication.


Post Comment

Only logged in users are allowed to post comments. Register/ Log in