


U.S. Recession Explanations, Does the ECRI Believe Its Own Economic Indicators?
Politics / Economic Statistics Mar 05, 2012 - 01:10 PM GMTBy: Mike_Shedlock

 Late last month in ECRI Sticks with Recession Call on CNBC; More than a Bit of an Exaggeration by Achuthan to Make His Call? I questioned the ECRI's use of coincident indicators to make a claim regarding recession
I count three instances between 1990 and 2000 where ECRI coincident indicators flagged a recession by the methodology Achuthan cited.
I have numerous other problems historically with ECRI claims, including their alleged "perfect" track record. Please see A Look at ECRI's Recession Predicting Track Record for details.
This time, I happen to think Achuthan has very valid points. However, once again, Achuthan has a hard time articulating them in a purely factual manner in spite of the fact he is clearly bright and articulate.Email Response From ECRI
In response to that article, reader "Art" sent an email to the ECRI and received this email back from Melinda Hubman, ECRI Managing Director, Operations.
Hi Art,Disingenuous Response
Actually, it is incorrect to say that the U.S. Coincident Index (USCI) year-over-year growth rate dropped even more in ~91, 95 & 98 and no recession followed.
We have attached an Excel file showing the straightforward calculations, based on the USCI data available from ECRI’s website (http://www.businesscycle.com/reports_indexes/allindexes).
The latest USCI growth rate is 1.94% (which can be rounded off to 1.9%). In January 1996, it had dropped only to 2.06% (which can be rounded off to 2.1%). This was certainly not below current readings. Of course, no recession followed.
In 1998, the USCI growth came nowhere near current readings, so the question doesn’t arise. It wasn’t until January 2001 that it fell below 2%, and the recession began two months later.
The attached worksheet marks all months when USCI growth, rounded off to one decimal place, fell to 2.1% (marked in blue) or to 2.0% or below (marked in red).
If you look at all the occasions in the last 50-plus years when USCI growth fell to 2.0% or below (marked in red), it is clear that recessions began around those dates (obviously, we don’t include the occasions when USCI growth had risen through 2.0% following the recessions).
In sum, it is precisely accurate to claim that y-o-y USCI growth has never dropped to current readings in the past 50-plus years without a recession ensuing.
Kind regards,
Melinda Hubman
Managing Director, Operations
ECRI
I am rather amazed at the disingenuous response from the ECRI.
The ECRI rounded down 1.94% to 1.9% then rounded up 2.06% to 2.1% to make their claim. Really! You cannot make this stuff up.
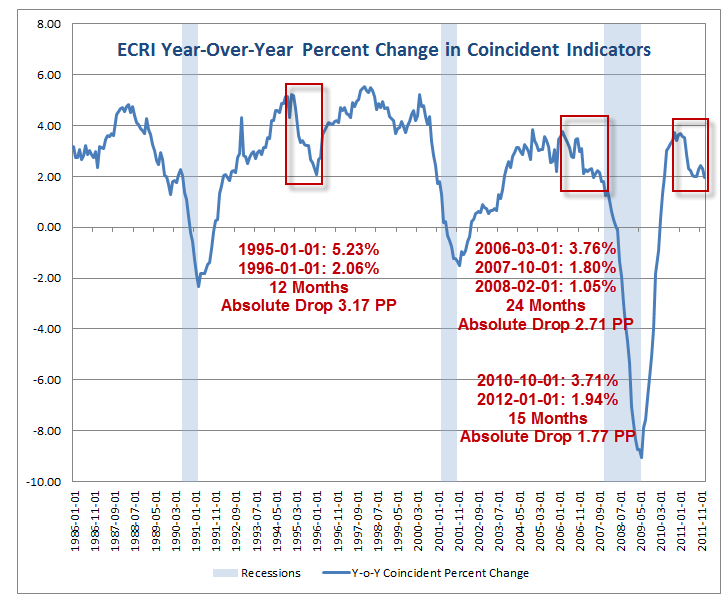
The ECRI sent an excel spreadsheet to reader Art, and I took that exact spreadsheet and created a chart from it. Here is my chart.
ECRI Year-Over-Year Percent Change in Coincident Indicators
Incredulous Defense
Somehow the ECRI wants us to believe that a year-over-year plunge in coincident indicators from 3.71% to 1.94% (a 1.77 percentage point drop in 15 months) is more important than the 1995-1996 plunge from 5.23% to 2.06% (a whopping 3.17 percentage point drop in 12 months).
I am not the only one in disbelief of this ridiculous position.
Georg Vrba, P.E. wrote a pair of articles on Advisor Perspectives on the subject.
- Deconstructing ECRI's Defense of its Recession Call
- The Elusive 2012 Recession: When Can We Expect It?
Is There Something Magic About 2 Percent?
I want to continue the discussion with a point Vrba missed, specifically the "magic" 2 percent threshold.
Melinda Hubman, ECRI Managing Director, took great "rounding" pains to defend a dip below 2 percent as if a decline to 1.94 percent was significant but a far bigger percentage point decline to 2.06% was not.
Indeed.
Spotlight 2007
Please take a good look at that chart created using ECRI data, supplied by the ECRI. What I want you to focus on is the decline in March of 2006 from 3.76% to 1.80% in October of 2007, all the way to 1.05% in February of 2008.
Please consider this image clip from the November-December 2007 ECRI Outlook (now conveniently redirected by the ECRI to another spot).
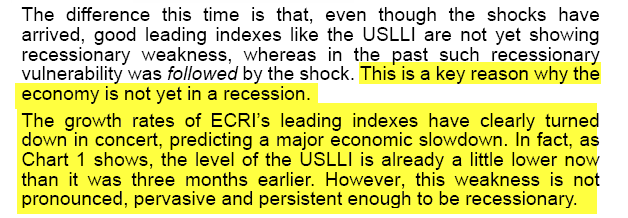
Got that?
The ECRI in its November-December 2007 Outlook, in spite of that massive drop in coincident indicators, in spite of a recession that I believe should have been obvious, actually said "this weakness is not pronounced, pervasive and persistent enough to be recessionary"!
Coincident indicators did not appear to be a concern at all in 2007, now (out of the blue), they are paramount.
Saturday, January 05, 2008
ECRI Says Fed Has Room To Cut Rates Despite Fears of Inflation
"WLI growth is now at its worst reading since the 2001 recession. However, the WLI's recent decline is not based on pervasive weakness among its components, suggesting that a recession could still be averted," Achuthan said.Somehow a recession that had already started could be avoided.
Friday, January 25, 2008
ECRI Says There Is A Window of Opportunity for the US Economy
The U.S. economy is now in a clear window of vulnerability, given the plunge in ECRI’s Weekly Leading Index (WLI) since last spring. Yet there is a brief window of opportunity within that window of vulnerability to avert a recession. That is why ECRI has not yet forecast a recession.Amazingly, in a recession that was now two months old, with coincident indicators all the way down to 1.05%, the ECRI saw a "Window of Opportunity" to avoid a recession.
If we have a recession this year, it would turn out to be the most widely anticipated recession in history. Clearly, the pessimism of consumers and business managers could cause them to cut spending, creating a self- fulfilling recession prophecy. But there is another side to the story.
At turning points, a few months’ lag in policy action can be immensely costly. If it spells the difference between a recession and a soft landing, a couple of months’ delay can end up costing a couple of million jobs and couple of hundred extra basis points in rate cuts – and still not have the same effect. What a stitch in time can accomplish early in a down cycle cannot be achieved, even with far more aggressive action, a few months down the road. At best, forceful but delayed action can mitigate the severity of a recession.
What's even more amazing is the ECRI's discussion of a "soft landing"!
Friday, March 28, 2008
ECRI Calls it "A Recession of Choice"
The U.S. economy is now on a recession track. Yet this is a recession that could have been averted. In January, given the plunge in the Weekly Leading Index, we declared that the economy had entered a clear window of vulnerability. Yet we emphasized the brief window of opportunity within that window of vulnerability for timely policy stimulus to head off a recession.ECRI Digs Deeper and Deeper Holes
The bottom line is that the outcome was not pre-ordained. Policy-makers had a choice about the speed with which stimulus took effect. If they had understood this, their actions could indeed have averted this recessionary downturn.
At the end of March the ECRI was still in denial about the recession that was then four months old! Amazingly, the ECRI has the unmitigated gall to claim a perfect track record at predicting recessions.
By the way, according to the Excel spreadsheet sent to Art, the ECRI monthly coincident index was .62 on March 1, 2008 and .32 on April 1, 2008 (the ECRI having finally thrown in the towel just 4 days prior).
In attempting to defend the indefensible, and by attempting "mind over indicators" the ECRI has dug a hole that is impossible to get out of.
Does the ECRI Even Believe Its Own Indicators?
I have to ask a serious question. Does the ECRI even believe its own indicators?
If it does, then why did the ECRI refuse to see a recession in late 2007 that should have been blatantly obvious? If it does, then why all these contortions now?
The only explanation I can come up with is Achuthan and the ECRI form an opinion, then twist and turn past history to defend it.
In this case, the ECRI made extensive use of coincident indicators to make its point, having totally ignored coincident indicators in similar conditions as recently as 2007. When you do that, you miss things, serious things, as I pointed out above.
As a result, the ECRI looks ridiculous.
On Making Mistakes
Regardless of how it may look, I do not have anything against the ECRI per se. Everyone makes mistakes. I have made dozens and I will make dozens more. The only way to not make mistakes is to not predict anything. However, I do have problems with people twisting facts and making claims known to be inaccurate.
The problem the ECRI has is twofold.
- Pretending they have a perfect track record when they don't
- Twisting and contorting their own indicators to say what they want them to say
One can only get away with each of those for so long. Indeed, on point number two, I would have to say the ECRI's interpretation has been good enough, long, enough, to generally mask the problem.
However, repeated cover-ups eventually blowup in spectacular fashion, just as they have done now.
About That 2012 Recession Call
In spite of all the above, I happen to like the ECRI recession call. Yes, I am biased, but it is hard to find anyone who is not.
I was way early in 2006 when the yield curve inverted, and I was early again this time, but never emphatic as was economist David Rosenberg with his June 13, 2011 "99% chance of US recession by 2012"
To go out on a limb, I think GDP in 2012 is going to hugely surprise on the downside, and 1st Quarter GDP may be as low as zero to .5%. A negative number (or more likely a revised negative number) would not shock me in the least.
If so, there is still room for the ECRI to be correct. The ECRI needs (by its own admission) a recession by mid-year to be correct. It will be interesting to see how much they twist and turn a few months from now.
However, even if GDP tanks big time, the NBER (the official designator of recessions) may not acknowledge the recession for another six months to a year.
In general, delayed NBER calls explain why the ECRI can also get away with late calls. However, it fails to explain why the ECRI stuck its neck out so early this time. The most likely explanation is as described earlier: "mind over indicators".
I don't care that much, recognizing that perfection is simply impossible. However, it does pose a big problem to the ECRI because they pretend they are perfect even though facts prove otherwise.
Mike "Mish" Shedlock
By Mike "Mish" Shedlock
http://globaleconomicanalysis.blogspot.com Click Here To Scroll Thru My Recent Post List
Mike Shedlock / Mish is a registered investment advisor representative for SitkaPacific Capital Management . Sitka Pacific is an asset management firm whose goal is strong performance and low volatility, regardless of market direction.
Visit Sitka Pacific's Account Management Page to learn more about wealth management and capital preservation strategies of Sitka Pacific.
I do weekly podcasts every Thursday on HoweStreet and a brief 7 minute segment on Saturday on CKNW AM 980 in Vancouver.
When not writing about stocks or the economy I spends a great deal of time on photography and in the garden. I have over 80 magazine and book cover credits. Some of my Wisconsin and gardening images can be seen at MichaelShedlock.com .
© 2012 Mike Shedlock, All Rights Reserved.
© 2005-2022 http://www.MarketOracle.co.uk - The Market Oracle is a FREE Daily Financial Markets Analysis & Forecasting online publication.