


Dow Jones Stock Market Diamond Pattern Formation
Stock-Markets / US Stock Markets Jan 22, 2008 - 10:09 AM GMTBy: Captain_Hook

 At first glance at the title above, because of the proliferation of Exchange Traded Funds (ETF's), with Dow Diamonds one of the most highly traded examples, one might think a discussion on the related subject matter is what we intend to talk about here today. Of course if you were an experienced market technician, and have been following the trade of late, you might have known right away this is not the case at all. You would have known what we are talking about is a technical formation in the trade that acts as a pivot at tops, usually in relation to larger degree trading ranges. And you also may have known that the Dow is almost finished tracing out another diamond at present, with the timing and circumstances when compared to the 1999 / 2000 sequence similar enough to take notice.
The following is a commentary that originally appeared at Treasure Chests for the benefit of subscribers on Wednesday, January 2, 2008.
And as you may remember from our last meeting , according to Dow Theory , more recent precedents in the Decennial Pattern (‘98 was a bad year for stocks), and the fact positives associated with election years appear to get discounted earlier all the time now (2000 was a bad year for stocks despite it being an election year), this coming year may be a rocky one as well. What's more, and another observation made last week, we now have a contracting monetary base to deal with, where although monetary authorities are priming the pump regularly these days, those helicopter and heavy bomber engines might still stall out in the end despite these efforts. On this basis then, as with that of the year 2000, the present diamond in the Dow appears well placed, with the only real question being ‘do we get a head fake break higher with all this money being printed to thwart the conditions outlined above, or not?'
While we should note this is exactly what happened in 2000 due to all the misplaced Y2K liquidity floating around, where it could be argued this is why the diamond back at millennium's turn was bigger than the one we are looking at here as well, this time the trouble is for real, meaning the credit crunch is eating up increasing amounts of new liquidity provided today. This means it's possible no such false break higher occurs this time around. (See Goldman chart below for exemplar in this regard.) Of course we could always go sideways for most of the year like back in 2000, after the diamond top in January the trading range expanded considerably as you may remember. (See Figure 1)
Figure 1
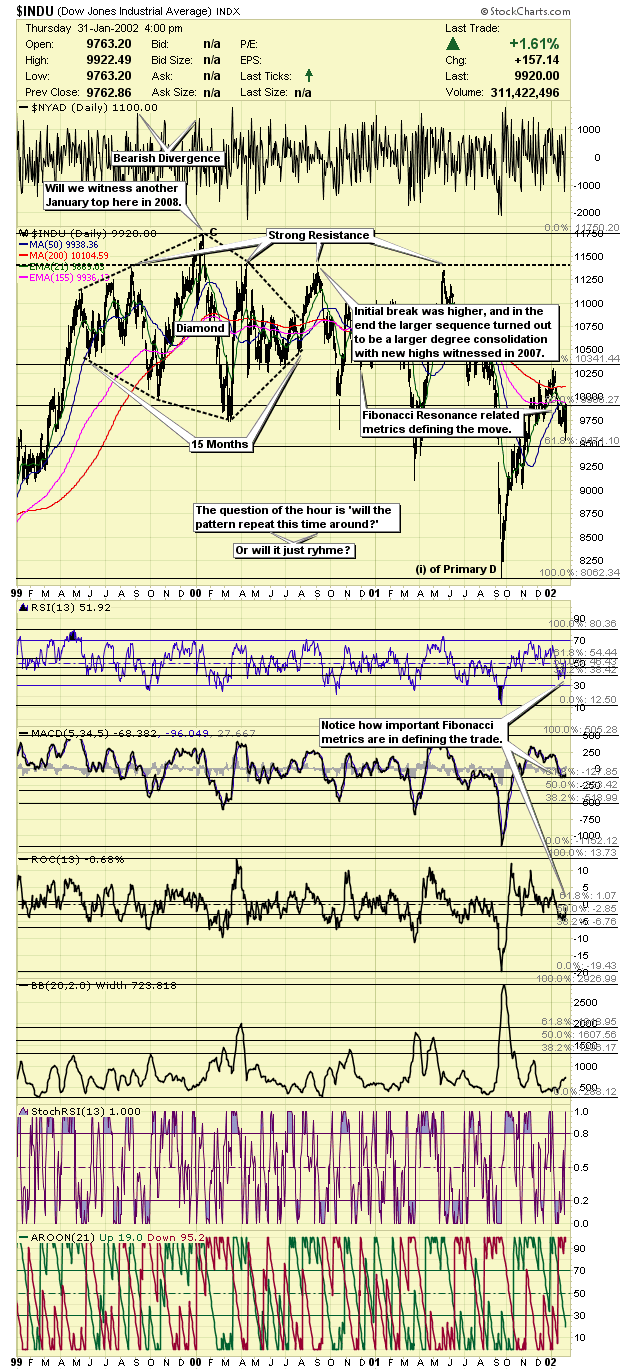
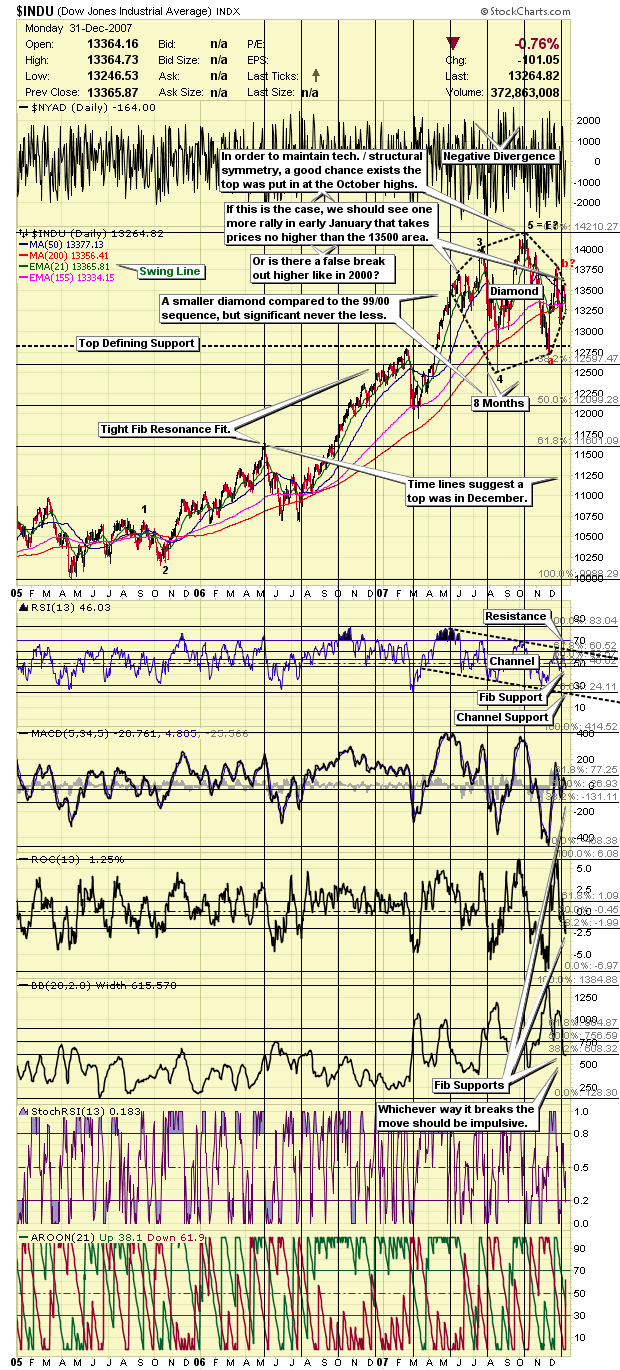
As mentioned above, this time around the diamond is much smaller in formation thus far, measuring only 8-months as opposed to 15-months back in 2000. Never the less however, the present structure is significant enough to do the job (marking the top), where in spite of the possibility that like in 2000 prices break higher first, ultimately they succumb to gravity once all the shorts are squeezed out. Moreover in this regard, while one would be pressed to call this an exact repeat of history, circumstances are developing such that they might be characterized as a good rhyme, where both traders and investors should take note. That is to say, and as with our official short-term outlook change noted below, apparently prices are set to move higher over the course of the next week or so at a minimum, where although last month's highs should not be taken out (options related / structural resistance on the S&P 500 (SPX) remains at 1500, so any volley's into this range should be sold / shorted), a larger degree squeeze could develop if speculators / hedgers alter more recent betting practices. (More on this below.) (See Figure 2)
Figure 2
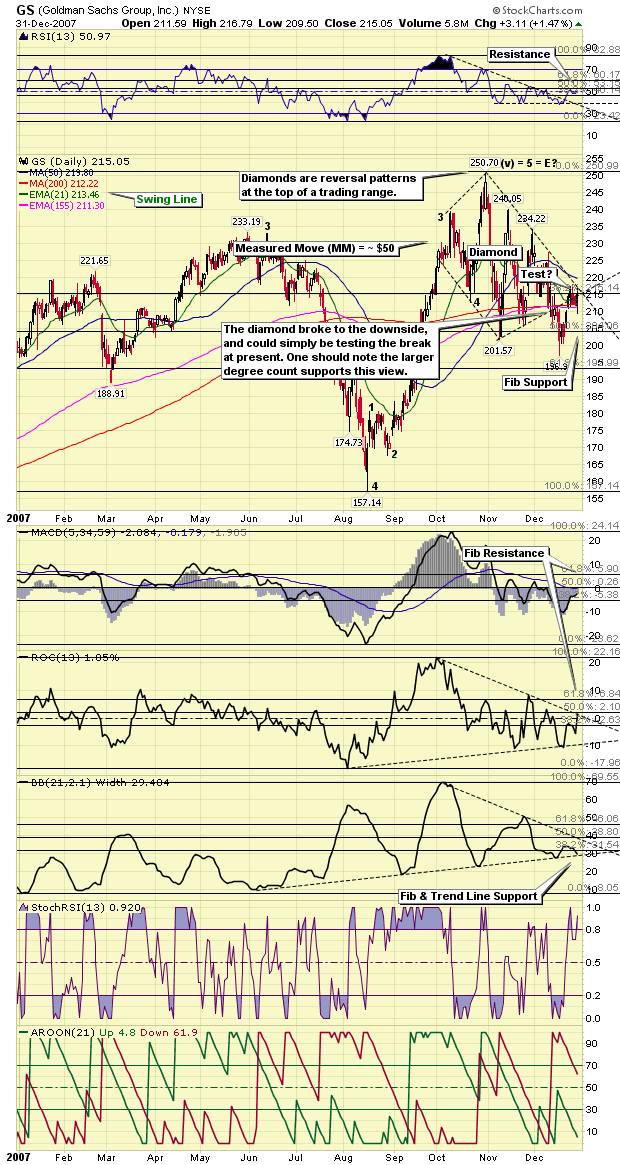
And just to complicate matters more, you may remember we mentioned some time ago to watch Goldman's chart because it was tracing out a diamond after being fully counted out. Well wouldn't you know it, Goldman breaks to the downside and is back testing this break as we speak, suggestive we should all be a great deal more bearish today than we were a few weeks ago. And although I can tell you from a look at the 10-minute bars that it has more upside after the five wave pattern traced out last week, if this move higher is just a corrective zigzag (implying that after one more lesser degree five wave pattern higher the move is done), then the same pattern witnessed in the Dow after a head fake higher in coming days should be expected, meaning the trend officially turns from up to down as stocks peel off into February. (See Figure 3)
Figure 3
This of course does not mean more volatility would not be in the cards (remember from our last meeting it appears options distributions on the cubes allow for one last rally into March like 2000), where if script is to remain similar to the 2000 sequence, although a mania like blow-off is probably not in the cards, more strength in tech stocks should be expected in March. (Note: This would put the finishing touches on a NASDAQ 100 / Dow Ratio top as well.) And in the ‘that's amazing department', one should find it striking that not only do options distributions match (also suggest) prices / tops should trace out a similar pattern to that of the year 2000, but also election year seasonals point to such an outcome as well. Here, if history is a good guide, we should see some degree of a top in stocks by next week (characterized by a false break higher out of the Dow diamond possibly), followed by weakness into late February, and then more strength into March. (See Figure 4)
Figure 4
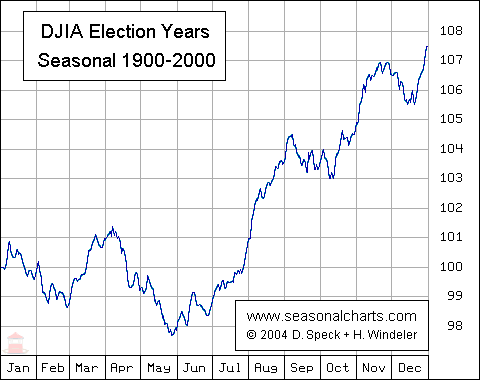
And such an outcome makes sense from a price management perspective in an election year, especially one like this one where the problems are most likely unfixable in the end. That is to say, price managers must be thinking if they get all the nasty stock market price action out of the way in the first half of the year maybe voters will forget about it if they can manage prices back up by November. Of course if speculators / investors are thinking the same thing, meaning put / call ratios are low at this time, then the stock market pattern will most likely resemble that of the year 2000, with a crash after a counter-seasonal summer rally (See Figure 5 ).
This is all speculation at this point of course, as a great deal of water must run under the bridge before we are able to better assess prospects for the second half of the year based on betting practices in the options market. Short-term however, it should be noted the open interest put / call ratio on the SPX was up to 1.75 on Monday, which is a big jump from last week, and is trending higher now. As a result of this, with put / call ratios the primary defining factor in determining market direction as you know, we are changing our official short-term outlook for both the broad market and precious metals to bullish from neutral. (Please note the hourly gold chart indicates the possibility of another leg down over the next day or two, so one might be wise to be patient.) And while this might only last a week or so if the balance of bearish observations kick in soon, as long as speculators are buying puts in size, you will definitely not find us on the bearish side of the ledger.
Thus, in terms of portfolio planning, for longer-term investors this does not mean you should go out and load the boat here. No – this possible opportunity is aimed more at the short-term trader. At the same time however, the count is telling everybody to get long, so what do you believe? Answer: For most you simply ensure your long-term ‘core positions' are in place and ride the waves. Remember, allocations of core positions should be the result of a well thought out plan consistent with your risk tolerances and objectives. If you need help in this department, please consult a professional in this regard.
That's all for today, where we will be back early next week to provide you with an update as to how changes in the variables listed above are developing, along with resulting implications for the markets.
Good investing in 2008 all.
By Captain Hook
http://www.treasurechestsinfo.com/
Treasure Chests is a market timing service specializing in value-based position trading in the precious metals and equity markets with an orientation geared to identifying intermediate-term swing trading opportunities. Specific opportunities are identified utilizing a combination of fundamental, technical, and inter-market analysis. This style of investing has proven very successful for wealthy and sophisticated investors, as it reduces risk and enhances returns when the methodology is applied effectively. Those interested in discovering more about how the strategies described above can enhance your wealth should visit our web site at Treasure Chests
Disclaimer: The above is a matter of opinion and is not intended as investment advice. Information and analysis above are derived from sources and utilizing methods believed reliable, but we cannot accept responsibility for any trading losses you may incur as a result of this analysis. Comments within the text should not be construed as specific recommendations to buy or sell securities. Individuals should consult with their broker and personal financial advisors before engaging in any trading activities, as we are not registered brokers or advisors. Certain statements included herein may constitute "forward-looking statements" with the meaning of certain securities legislative measures. Such forward-looking statements involve known and unknown risks, uncertainties and other factors that may cause the actual results, performance or achievements of the above mentioned companies, and / or industry results, to be materially different from any future results, performance or achievements expressed or implied by such forward-looking statements. Do your own due diligence.
Copyright © 2008 treasurechests.info Inc. All rights reserved.
Unless otherwise indicated, all materials on these pages are copyrighted by treasurechests.info Inc. No part of these pages, either text or image may be used for any purpose other than personal use. Therefore, reproduction, modification, storage in a retrieval system or retransmission, in any form or by any means, electronic, mechanical or otherwise, for reasons other than personal use, is strictly prohibited without prior written permission.
Captain Hook Archive |
© 2005-2022 http://www.MarketOracle.co.uk - The Market Oracle is a FREE Daily Financial Markets Analysis & Forecasting online publication.