


Stock Market Perched on the Edge
Stock-Markets / Stock Markets 2012 May 13, 2012 - 11:02 AM GMT

 Another great week of volatility, which is what traders want to trade, although we are perched now on the edge and an important choice needs to be made, very similar to what happened last year around this time.
I left readers with this chart from last weeks' article
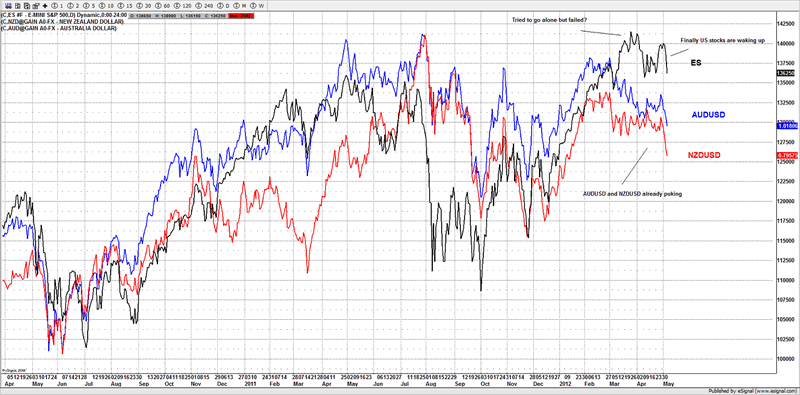
If you fast forward a week, we have seen continued selling in risk markets, and as long as this continues the market is in sell mode, only we are at a pivotal point in the US stock markets to confirm or negate if we are ever going to see a new high above the highs made in March 2012.
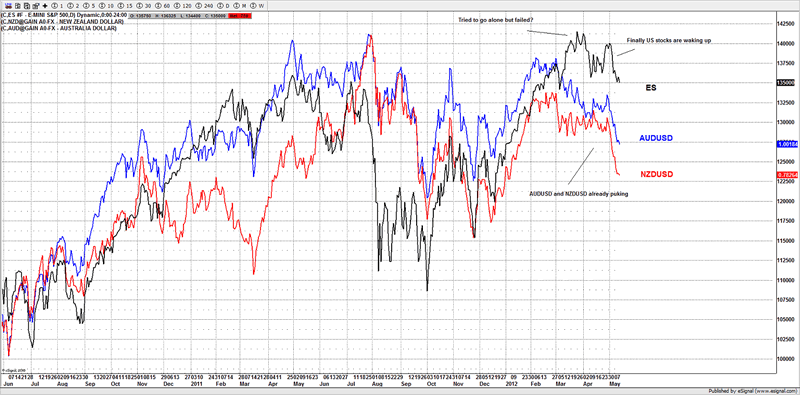
It's this chart that is making us $$, as its keeping us on the right side of the trend and we are selling risk markets, such as AUDUSD, NZDUSD, and US stocks. Pretty much all last week we were sellers of rallies in risk markets.
ES
We went into last week with this chart.
So our bias was already in sell mode as we pushed under support at 1375, which then had us look for lower targets towards 1352ES. So from Sundays open, we wanted to be selling the markets into 62ES, that had been a key area, and the markets spent most of the week chopping between 47ES and 63ES, after gapping down hard on Sunday, I felt the market needed to come back and test that break down area of 75ES, it got as far as 70ES before it rolled over again, that was the high for the week, as it continued to test the globex Sunday gap down lows and rally to 63ES.
Which with all the chop, started to suggest the market was involved in a triangle and some sort of 4th wave, as having bought the lows twice on Wednesday and Thursday, we continue to fail at the 60-63ES area, thus we had to consider a new low which is what we expect to see on Monday this coming week. We have an objective to see the 1333ES-1338ES before a decent rally should setup.
Even with the entire chop we navigated the gyrations well.
Friday had us looking to sell the 63ES-65ES area and cover at 70ES should the market have seen a strong bid.
We had this idea in the morning, just before the bell.
We were looking to sell 63-65ES with a stop at 70ES.
For a 5 point risk we took nearly 15 points as it hit our 47ES support area, where we took profits.
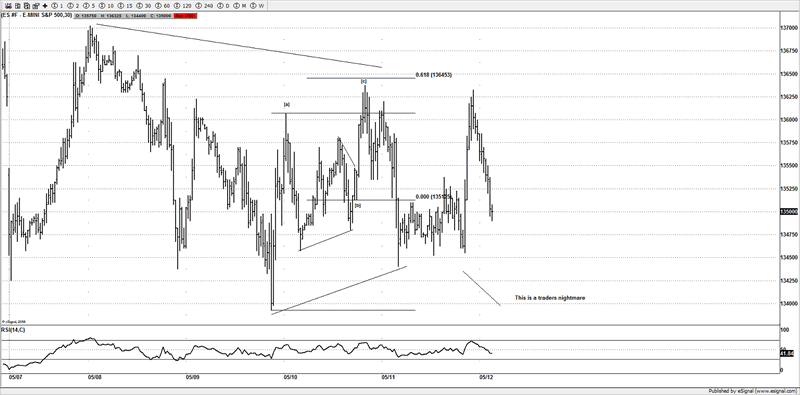
This is a traders nightmare for most traders, but then to us is paradise, as its just offers us opportunities to make $$.
But I guess we are just not your average traders. We find opportunities where most are not looking.
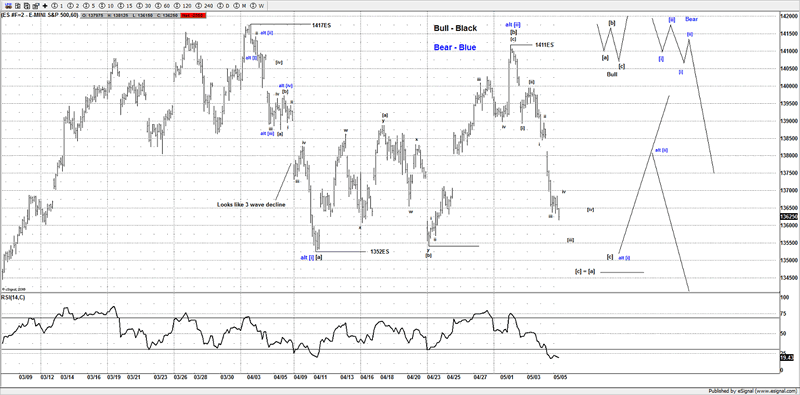
The next rally that will help us confirm if the "high is in".
Many traders are trying to work out if the March high was the "high" I am not convinced just yet, but we are working 2 ideas and I will simply go with whichever idea proves to be the correct idea.
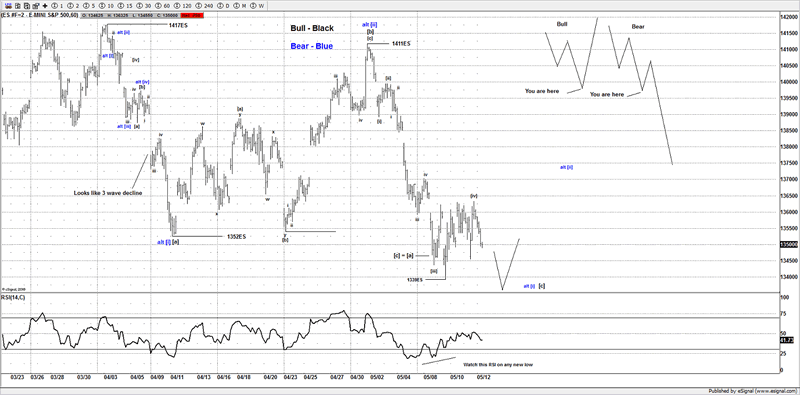
Any new low should complete the move from 1411ES and what we suspect is a 5 wave decline.
Depending on the next bounce will help confirm which idea is really working.
The bear idea suggesting this is a 12 12 setup and after a small bounce towards 1380-90ES we simply see a hard sell off.
The bull idea suggests that this is just a 3 wave decline from the 1417ES highs and about to set up a rally higher. But for now we see the next decent set up as a potential low, with some other markets looking ripe for a decent rally, we are turning our attentions to a potential 50+ handle rally. If we can nail it within 4-6 points it should be a 10 bagger.
GBPUSD
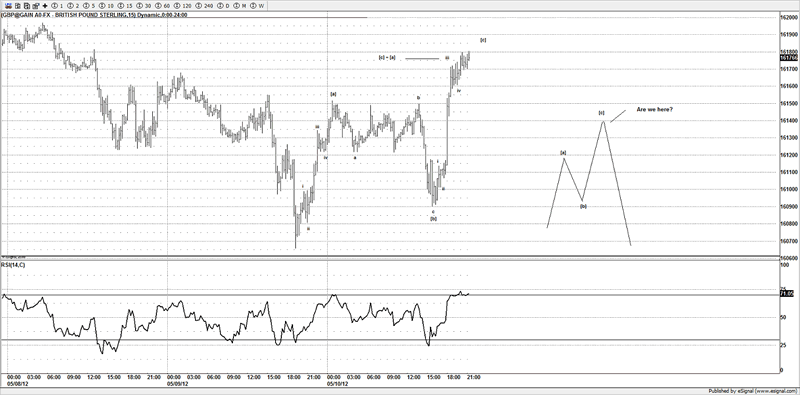
The forex markets were really quiet the past week and we struggled to find any quality ideas, it was not until later in the week that we found this, as we continue to "hunt" down for low risk ideas, this presented itself and when they setup like this, it's like stealing $$ legally.
When you see a text book 3 wave advance to a measured 1x1 target, you just have to trade these moves.
1x1 - [c] = [a]
Before
After
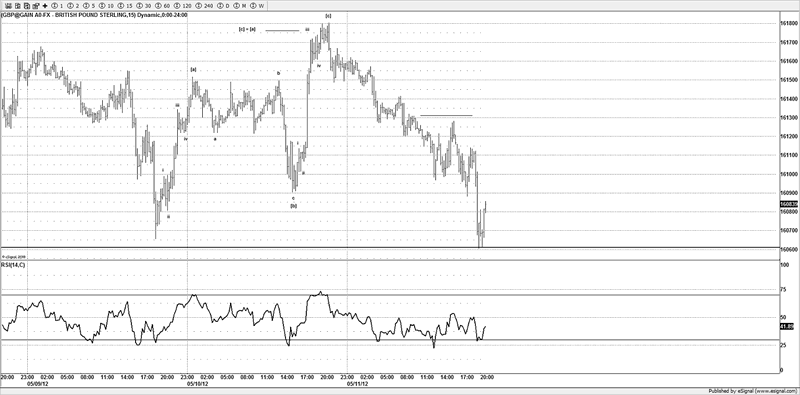
We risked 30 pips for just over 100 pips as our target was 16060. Give us those any day that is some of the easiest trading around.
Just that GBPUSD trade alone would have paid for your yearly subscription, using a 1 lot that's not including the many other trades we have "nailed" this year so far.
The markets are really starting to move around and it's this sort of environment I thrive on, as long as it moves I can usually find 1 or 2 ideas a day.
NDX
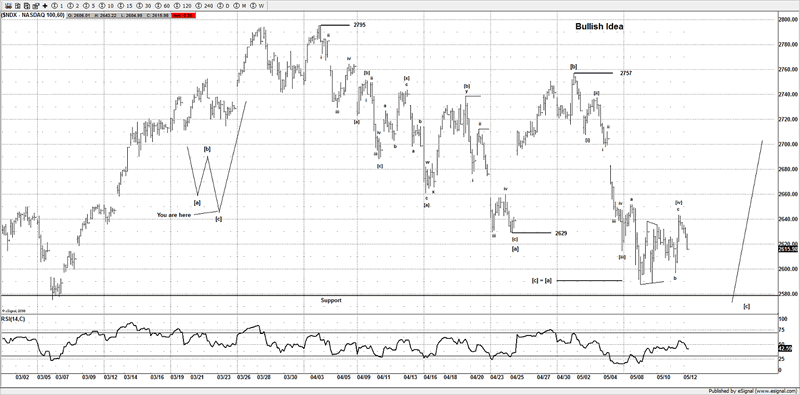
I see many technicians already have the "high" already in place and are looking for a crash, I am not convinced. I suspect the market may have one more high left in it.
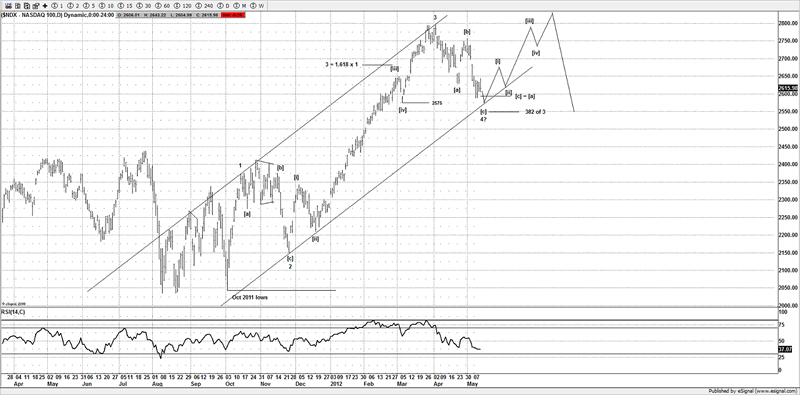
When I look at the daily chart of the NDX it suggests still that this is wave 4 from the Oct 2011 lows, in fact if you look at the other US markets they look similar.
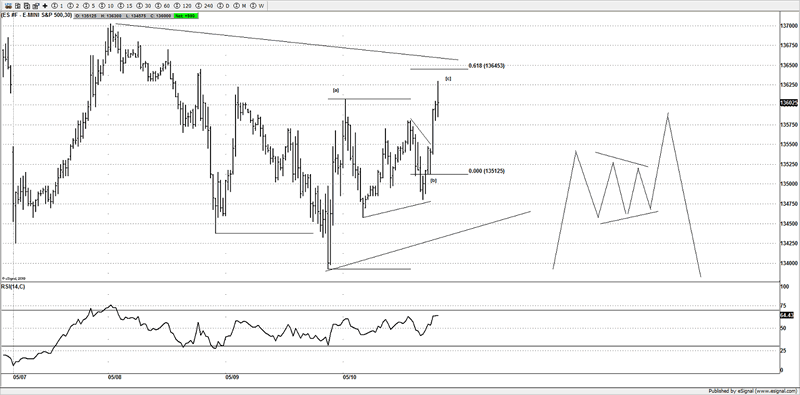
Of course nothing is ever 100%, and I will always adjust to what I see, but currently only see a 3 wave decline from the March 2012 highs into a measured 1x1 target where [c] = [a].
If I were to see something more bearish then I could get behind an aggressive move lower, but as it stands I don't see the evidence to support it.
I suspect traders are a little premature in placing a high in place. The trend is up on the daily time frame and I will continue to give the benefit to the bulls as long as we don't see any price action to negate this idea shown.
DOW
Short term the DOW looks like one of the cleanest ideas and I suspect on a new low would complete a 5 wave decline 13339. We should at least see a bounce to correct this decline, using our daily wave counts we should be able to confirm or negate quickly if we are going to see new yearly highs or not.
Conclusion
I don't see enough price action just yet to jump into the fur bear suit, although there is some ideas to watch should the bulls fail to deliver on any upside price action, so we will continue to trade it as we see it and adjust to whatever the market throws at us.
But as long as it keeps moving that is all we ask of this market, up or down we don't care, I can easily jump into a bull suit just as easily as a bear suit.
Making $$ is all that counts, we leave our ego at the door; we are only interested in successful trading.
Are you interested in trading alongside professionals that are finding quality setups week in week out?
If so come join us and reap the rewards from this market, you simply have nothing to lose, if my work don't suit you style, then simply ask for a refund inside the 1st 4 weeks from your joining date.
If you think it's too good to be true, come and see for yourself if I am the "real deal".
This week alone members made back 3 times their annual costs of membership, and that's just in the ES, let alone the other 15 or so markets we cover.
I ES point = I months subscription, but we have other levels of subscription to suit all traders.
So what are you waiting for?
Until next time.
Have a profitable week ahead.
Click here to become a member
You can also follow us on twitter
What do we offer?
Short and long term analysis on US and European markets, various major FX pairs, commodities from Gold and silver to markets like natural gas.
Daily analysis on where I think the market is going with key support and resistance areas, we move and adjust as the market adjusts.
A chat room where members can discuss ideas with me or other members.
Members get to know who is moving the markets in the S&P pits*
*I have permission to post comments from the audio I hear from the S&P pits.
If you looking for quality analysis from someone that actually looks at multiple charts and works hard at providing members information to stay on the right side of the trends and making $$$, why not give the site a trial.
If any of the readers want to see this article in a PDF format.
Please send an e-mail to Enquires@wavepatterntraders.com
Please put in the header PDF, or make it known that you want to be added to the mailing list for any future articles.
Or if you have any questions about becoming a member, please use the email address above.
If you like what you see, or want to see more of my work, then please sign up for the 4 week trial.
This article is just a small portion of the markets I follow.
I cover many markets, from FX to US equities, right the way through to commodities.
If I have the data I am more than willing to offer requests to members.
Currently new members can sign up for a 4 week free trial to test drive the site, and see if my work can help in your trading and if it meets your requirements.
If you don't like what you see, then drop me an email within the 1st 4 weeks from when you join, and ask for a no questions refund.
You simply have nothing to lose.
By Jason Soni AKA Nouf
© 2012 Copyright Jason Soni AKA Nouf - All Rights Reserved
Disclaimer: The above is a matter of opinion provided for general information purposes only and is not intended as investment advice. Information and analysis above are derived from sources and utilising methods believed to be reliable, but we cannot accept responsibility for any losses you may incur as a result of this analysis. Individuals should consult with their personal financial advisors.
© 2005-2022 http://www.MarketOracle.co.uk - The Market Oracle is a FREE Daily Financial Markets Analysis & Forecasting online publication.