


More Stock Market Interim Rally Ahead?
Stock-Markets / Stock Markets 2012 May 29, 2012 - 02:08 AM GMTBy: Andre_Gratian

 Current Position of the Market
SPX: Very Long-term trend - The very-long-term cycles are down and, if they make their lows when expected (after this bull market is over) there will be another steep and prolonged decline into late 2014. It is probable, however, that the steep correction of 2007-2009 will have curtailed the full downward pressure potential of the 120-yr cycle.
SPX: Intermediate trend - Correction
Analysis of the short-term trend is done on a daily basis with the help of hourly charts. It is an important adjunct to the analysis of daily and weekly charts which discusses the course of longer market trends.
Market Overview
The market correction which started in early April is not over and, based on cycles, may run into late-July/early-August before it is. Six days ago, the SPX completed a phase projection and has been consolidating since. From a cyclical viewpoint, there are two possible scenarios for what lies directly ahead: there is a cycle cluster due in mid-June which could turn out to be a high or a low point for the market. I lean toward its being a high because of the more dominant cycles that have recently bottomed, and are about to bottom in the next few days, and which will be setting the trend for the following couple of weeks. (If there is enough upward pressure from the longer-term cycle which has already made its low, it is possible that SPX might even start extending its uptrend past the recent highs right away.)
If this is the case, the current consolidation should end with an extension of the interim rally to about 1340 or higher. It will be followed by the final leg of the correction into the time frame mentioned above, and could reach as low as 1235-1245 before it ends. If this turns out to be the completion of wave 4 from 1075, the index should then start wave 5 and rise to a new high before completing it.
This forecast is a guesstimate based on cycles and structure. It will be refined or modified, if need be, as the market trend evolves.
Chart analysis
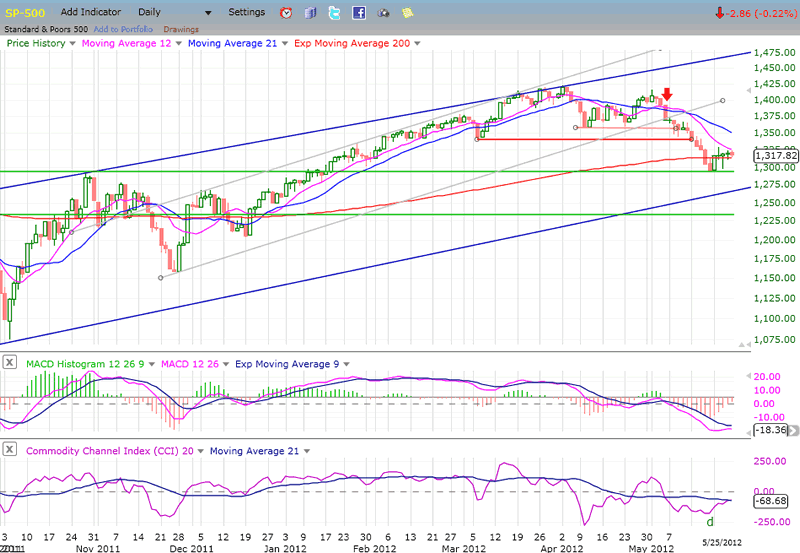
On the Daily Chart, we see that SPX is now traveling in the blue channel which defines its current trend. If the target which I have set for the low of the correction is valid, the decline should end outside of the channel and find support on the lower green line, just as it did on the upper one. For now, the 200-DMA is also adding temporary support. It has already been violated, but it does not matter even if it is decisively broken, providing that prices can move back above it as they did during last year's August to December consolidation.
On the P&F chart, there were two separate phases of distribution which formed at the SPX top. The shortest one, taken across 1411, gave us a count to 1304 which was slightly exceeded as the decline ran its course.
There is another count that could be taken at the 1397 level that has stored enough negative energy to take prices down as low as 1235, although the likely bottoming range should be somewhere between 1235 and 1255. I'll be able to refine this count as soon as the current consolidation is over.
The CCI developed some divergence at the recent low, and this argues for an extension of the interim rally before the correction continues. The MACD has no such divergence, only slight deceleration. This suggests that lower prices will be seen before the correction is over.
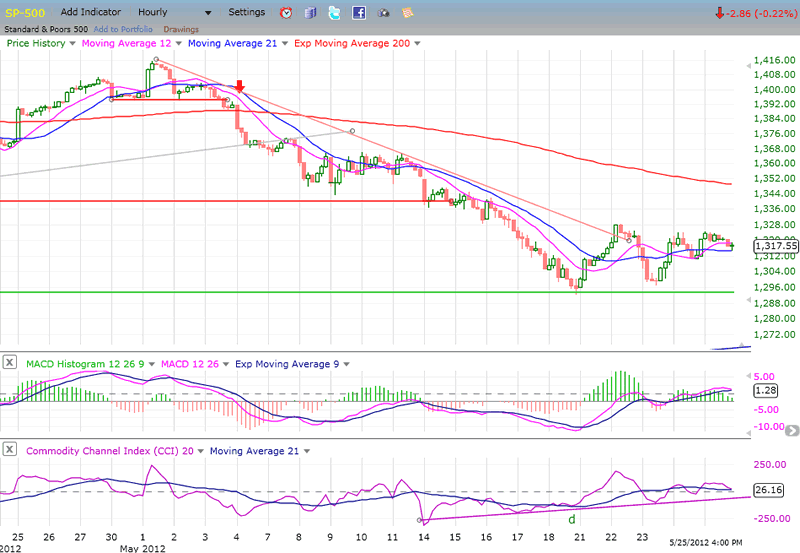
We can better visualize the status of the consolidation on the Hourly Chart. The initial low was successfully tested a couple of days later, but it only produced a weak bounce which appears to be running out of steam. Two closely related cycles caused the two lows that you see on the chart, and two more that are expected to make their lows by Friday/Monday, could prolong the basing pattern until then. A rally should start soon after the cycles have bottomed, if not before. As soon as the recent high of 1318 has been exceeded, we can estimate how far it will carry.
Cycles
The half-span of the 66-wk cycle made its low on the 18th, followed by the bottoming of a smaller cycle a couple of days later.
A 28-30 day cycle is due either Friday or Monday, along with a Kress cycle of undetermined length.
This group of cycles should initiate a two-week rally into the middle of next month. This will have to be confirmed by market action in the first week of June.
Breadth
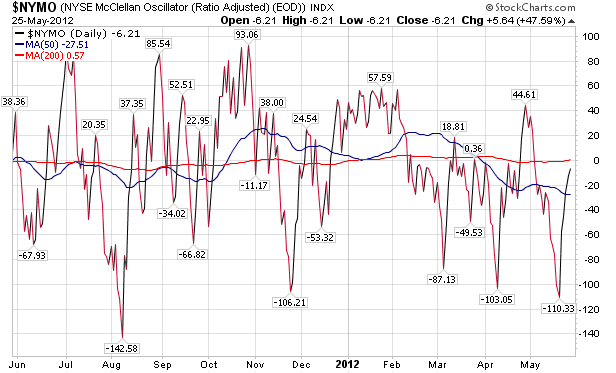
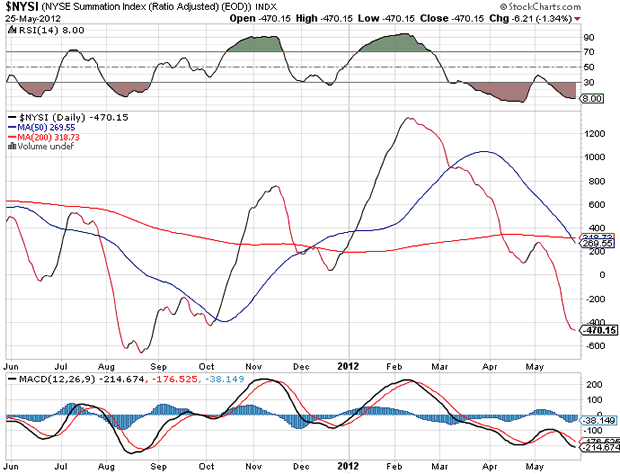
Below, I show the NYSE McClellan oscillator (NYMO) as well as the NYSE Summation Index (NYSI), both courtesy of StockCharts.com.
Let's first look at the lower one (NYSI). The decline which started in February only paused briefly before continuing to make new lows in spite of the deeply oversold state of its RSI. As a result of the current near-term consolidation, the decline in the index has decelerated but not reversed, while the RSI, which is at its most deeply oversold level in three years, is showing the positive divergence which normally precedes a rally in the index as well as in the market. This is another reason to expect a rally as soon as the next two cycles have bottomed (or sooner). However, if history repeats itself, some positive divergence will have to show in the NYSI itself vs. the SPX before we can call an end to the price decline. This cannot take place unless we first have a price rally followed by a decline to a lower level. (This kind of bottom formation occurred at last year's September-October lows.)
The NYMO continues to trade predominantly in its negative zone. However, if the cycles perform as expected, in a few days (if not before) it will have the opportunity to become positive and remain so for about two weeks.
Sentiment Indicators
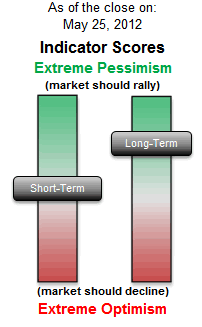
The SentimenTrader's (courtesy of same) long-term index showed its highest reading of extreme pessimism (bullish) when the SPX was nearing its recent low. Since then, as the market began to consolidate, it has dropped slightly but continues to maintain a fairly high rate of pessimism. It may continue to drop as the market rallies, but should rise again as the decline continues, and once again be near the top of its range when the SPX makes is final correction low.
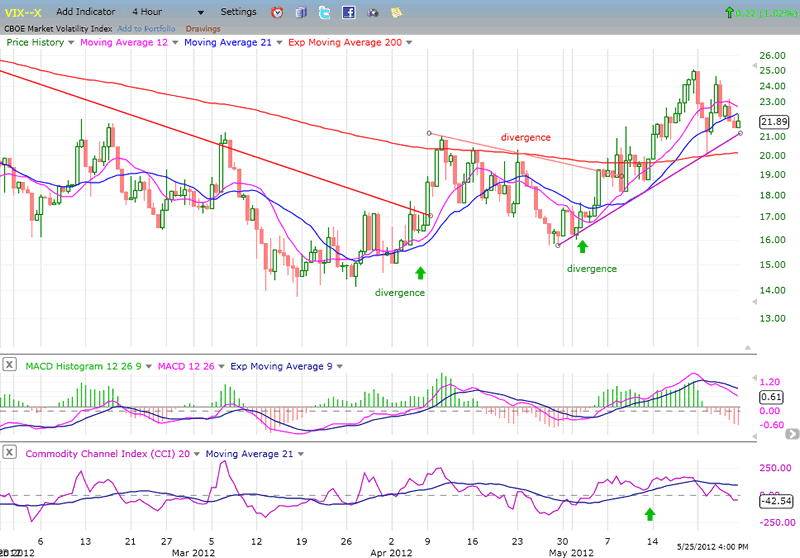
The VIX
The VIX is mimicking the SPX in reverse. At the daily level, there is no bullish indication coming from VIX, but there is some minor one at the hourly. If it persists as the cycles make their lows over the next few days, it will signal the market is about to rally. We should watch for it.
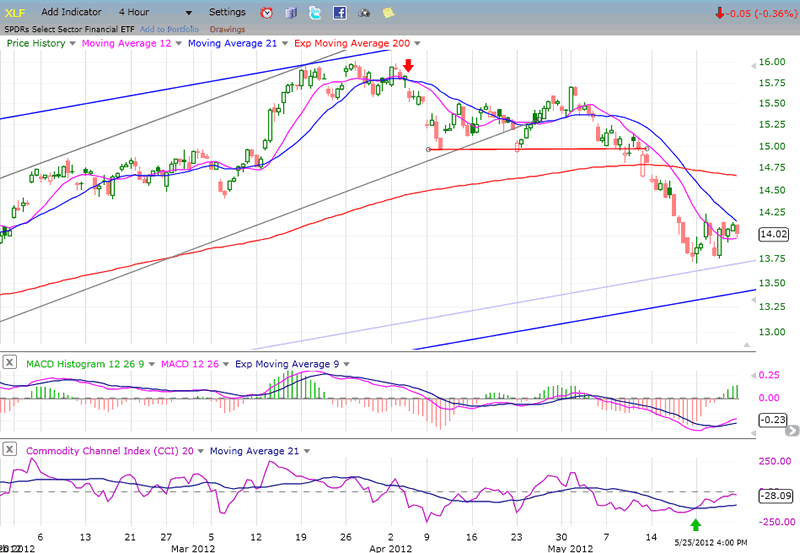
XLF (Financial SPDR)
By contrast, the XLF (below) is in perfect sync with the SPX at the hourly level, but a smidgen of positive divergence could appear in the next few days.
The daily charst are also in sync, but some positive divergence could (should?) emerge when we near the end of the intermediate correction.
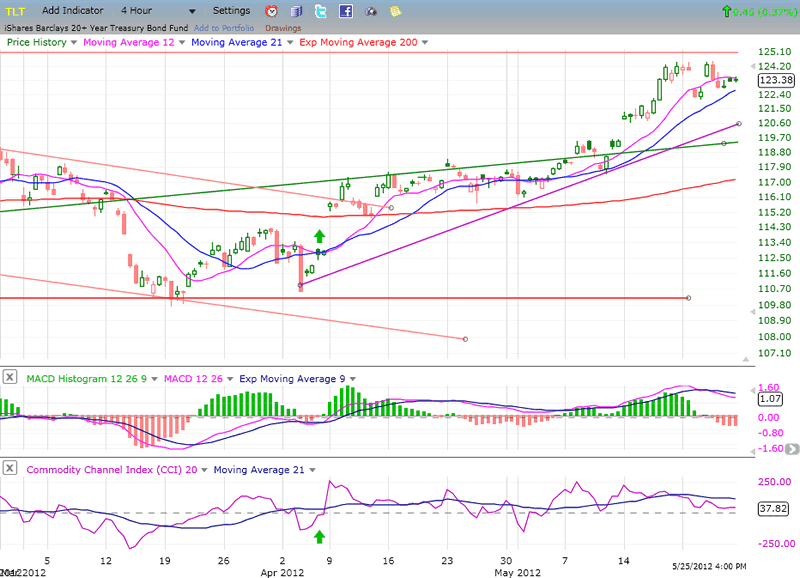
BONDS
TLT has done well in this downtrend. It came very close to making a new high, and could exceed 125 before the correction in equity markets is over. On the P&F chart, there is a potential count to 129.
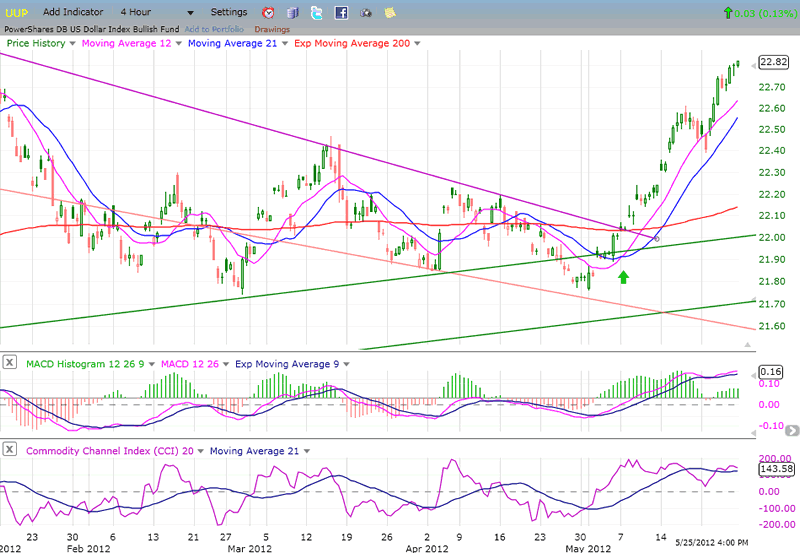
UUP (Dollar ETF) Daily Chart.
The dollar has benefited from the weakness in the Euro and this has put UUP in a strong short-term uptrend. At the 22.82 close on Friday, It has now filled its initial P&F count of 22.80 and has nearly duplicated its high of mid-January. As a result of the re-accumulation phase that you see on the chart, a count taken at the 22 level gives it a potential target of 23.80, but the indicators are showing some deceleration in the MACD, and the beginning of negative divergence in the CCI. This could invite a pause in the uptrend if the Euro begins to rally which could lead to an early resumption of the rally in equities.
The Euro (24.68) has a potential short-term drop to about 22. This could come later and send UUP to 23.30. There are lower counts for the Euro, but they will probably be met later, perhaps in July. This could be when UUP makes it to 23.80.
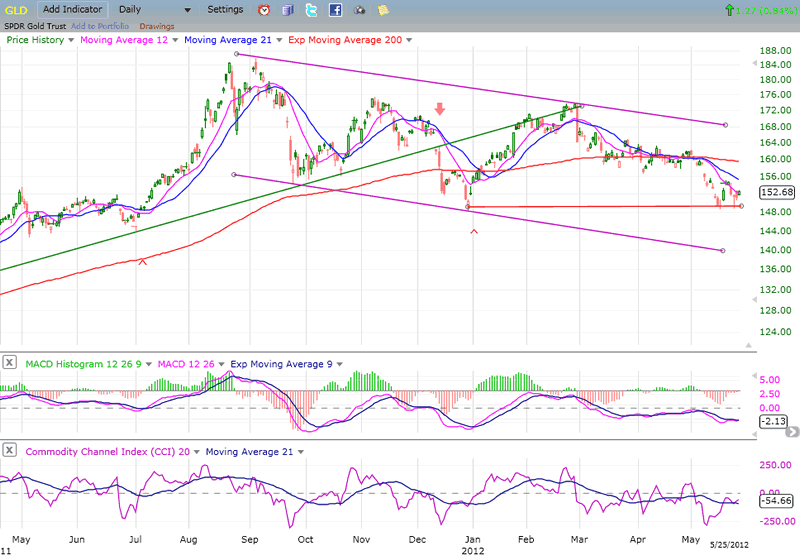
GLD (ETF for gold)
In spite of holding at its previous 25-wk cycle low, GLD (below) still looks precarious and quite capable of reaching the 141 target which was derived from its near-term count. This is a confirmation of the same count which was taken at the 175 level after GLD reversed its long-term trend. When GLD has reached 141, we will re-assess its long-term position.
The current weakness is primarily driven by the next 25-wk cycle which is due to make its low in mid-June.
That seems to go against the scenario proposed for the SPX which intimates that that time frame should be a high for the equity indices. We'll have to see how this seeming discrepancy resolves itself.
OIL (USO)
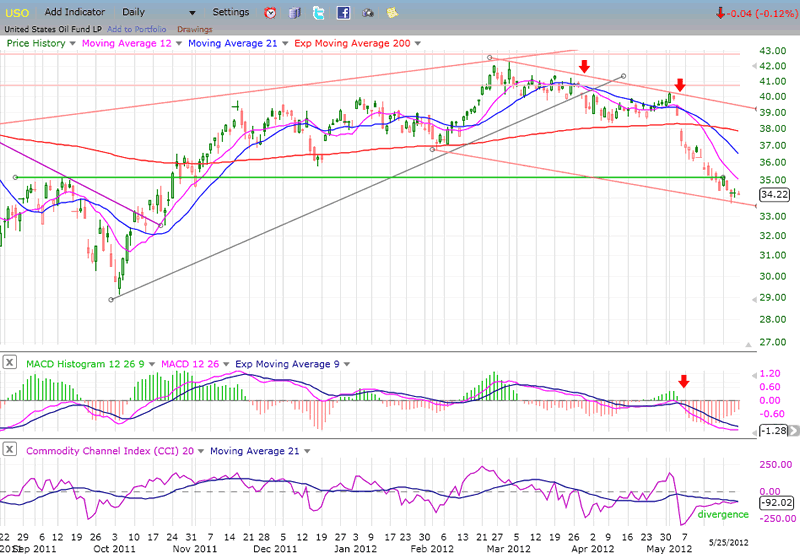
USO (above) is just starting to consolidate after reaching a near-term target of 34. That puts it at the bottom of a channel and on top of good support. But this is a conservative target and it may only bring about a brief interruption to the decline. Based on the P&F formation, it is possible for the price to move even lower (30.50?).
The weekly CCI is at an extreme and the daily one is showing some positive divergence -- more indications that USO is likely to consolidate at this level.
USO is relatively weaker than the SPX on a short and on a long-term basis.
Summary
Since meeting its conservative downside target of about 1304, SPX has been consolidating. As a result of the current cyclical configuration, it is likely that this consolidation will expand upward over the next two weeks with a move to 1340 or higher.
This should only be a continuation of the interim rally which started at 1297 and not the beginning of a new uptrend. Another down leg is expected before the correction which started at 1422 is over.
FREE TRIAL SUBSCRIPTON
If precision in market timing for all time framesis something that you find important, you should
Consider taking a trial subscription to my service. It is free, and you will have four weeks to evaluate its worth. It embodies many years of research with the eventual goal of understanding as perfectly as possible how the market functions. I believe that I have achieved this goal.
For a FREE 4-week trial, Send an email to: ajg@cybertrails.com
For further subscription options, payment plans, and for important general information, I encourage
you to visit my website at www.marketurningpoints.com. It contains summaries of my background, my
investment and trading strategies, and my unique method of intra-day communication with
subscribers. I have also started an archive of former newsletters so that you can not only evaluate past performance, but also be aware of the increasing accuracy of forecasts.
Disclaimer - The above comments about the financial markets are based purely on what I consider to be sound technical analysis principles uncompromised by fundamental considerations. They represent my own opinion and are not meant to be construed as trading or investment advice, but are offered as an analytical point of view which might be of interest to those who follow stock market cycles and technical analysis.
Andre Gratian Archive |
© 2005-2022 http://www.MarketOracle.co.uk - The Market Oracle is a FREE Daily Financial Markets Analysis & Forecasting online publication.