


Using Standard Deviation & Probability to Trade Options
InvestorEducation / Options & Warrants Jun 28, 2012 - 11:08 AM GMTBy: J_W_Jones

 I recently discussed the ability to use implied volatility to calculate the probability of a successful outcome for any given option trade. To review briefly, the essential concepts a trader must understand in order to make use of this helpful metric include:
- The prices of any given underlying can be considered to be distributed in a Gaussian distribution- the classic bell shaped curve.
- The width of the spread of these prices is reflected in the standard deviation of the individual underlying’s distribution curve.
- Plus / minus one standard deviation from the mean will include 68% of the individual price points, two standard deviations will include 95%, and three standard deviations will include 99.7%
- A specific numerical value for the annual standard deviation can be calculated using the implied volatility of the options using the formula: underlying price X implied volatility
- This standard deviation can be adjusted for the specific time period under consideration by multiplying the value derived above by the square root of the number of days divided by 365
These derived values are immensely important for the options trader because they give definitive metrics against which the probability of a successful trade can be gauged. An essential point of understanding is that the derived standard deviation gives no information whatsoever on the direction of a potential move. It merely determines the probability of the occurrence of a move of a specific magnitude.
It is important to note that no trade can be established with 100% probability of success; even boundaries of profitability allowing for a three standard deviation move have a small but finite probability of moving outside the predicted range. A corollary of this observation is that the trader must NEVER “bet the farm” on any single trade regardless of the calculated probability of success. Black swans do exist and have a nasty habit of appearing at the most inopportune times.
Let us consider a specific example of a “bread and butter” high probability option trade in order to see how these relationships can be applied in a practical manner.
The example I want to use is that of an Iron Condor position on AAPL. For those not familiar with this strategy, it is constructed by selling both a call and put credit spread. The short strikes of the individual credit spreads are typically selected far out of the money to reduce the chance they will be in-the-money as expiration approaches.
I want to build an iron condor on AAPL in order to illustrate the thought process. As I type, AAPL is trading at $575.60. August expiration is 52 days from today; this is within the optimal 30-55 day window to establish this position. Consider the high probability call credit spread illustrated below:
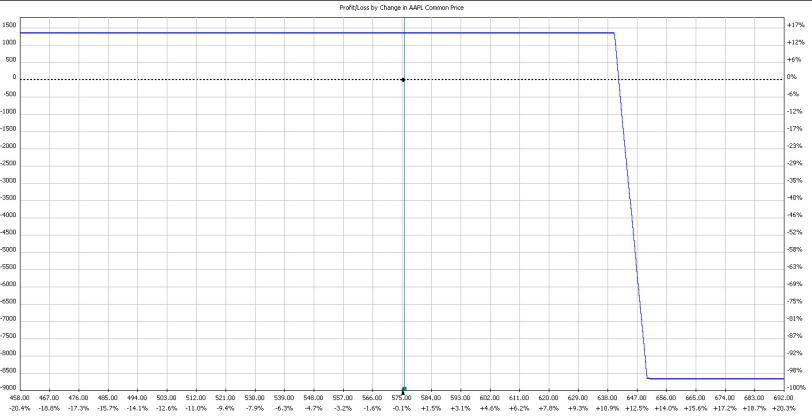
This trade has an 88% probability of profit at expiration with a yield of around 16% on cash encumbered in a regulation T margin account.
Now let us consider the other leg of our trade structure, the put credit spread. Illustrated below is the other leg of our iron condor, the put spread:
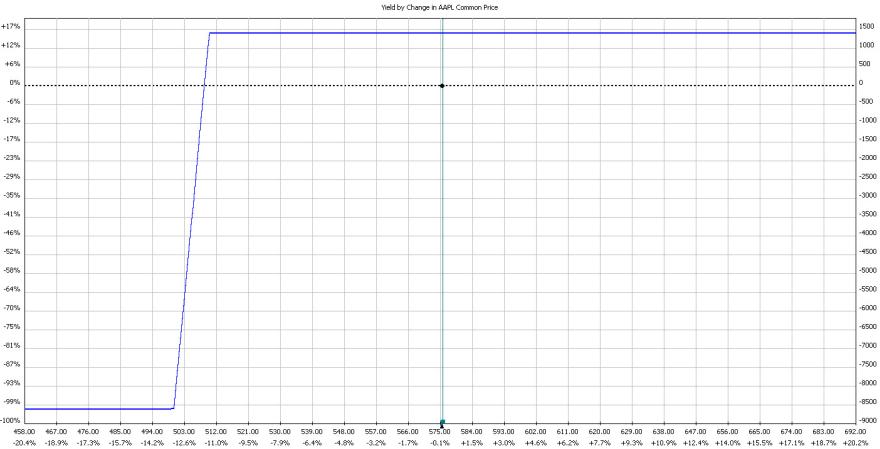
This trade has a 90% probability of profit at expiration with a yield of around 16% on cash encumbered in a regulation T margin account. As the astute reader can readily see, this put credit spread is essentially the mirror image of the call credit spread.
When considered together, we have given birth to an Iron Condor Spread:
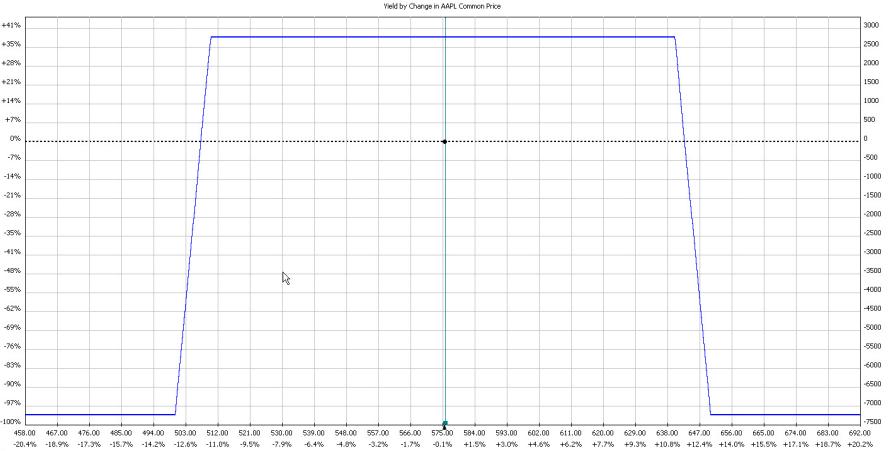
The resulting trade consists of four individual option positions. It has a probability of success of 79% and a return on capital of 38% based on regulation T margin requirements. It has an absolute defined maximum risk.
Note that the probability of success, 79%, is the multiplication product of the individual probabilities of success for each of the individual legs.
This trade is readily adjustable to be reflective of an individual trader’s viewpoint on future price direction; it can be skewed to give more room on either the downside or the upside.
Another characteristic and reproducible feature of this trade structure is the inverse relation of probability of success and maximum percentage return. As in virtually all trades, more risk equals more profit.
I think this discussion illustrates clearly the immense value of understanding and using defined probabilities of price move magnitude for option traders. Understanding these principles allows experienced option traders to structure option trades with a maximum level of defined risk with a relatively high probability of success.
Happy Option Trading!
 If you are looking for a simple one trade per week trading style then be sure to join www.OptionsTradingSignals.com today with our 14 Day Trial.
J.W. Jones is an independent options trader using multiple forms of analysis to guide his option trading strategies. Jones has an extensive background in portfolio analysis and analytics as well as risk analysis. J.W. strives to reach traders that are missing opportunities trading options and commits to writing content which is not only educational, but entertaining as well. Regular readers will develop the knowledge and skills to trade options competently over time. Jones focuses on writing spreads in situations where risk is clearly defined and high potential returns can be realized.
This article is intended solely for information purposes. The opinions are those of the author only. Please conduct further research and consult your financial advisor before making any investment/trading decision. No responsibility can be accepted for losses that may result as a consequence of trading on the basis of this analysis.
© 2005-2022 http://www.MarketOracle.co.uk - The Market Oracle is a FREE Daily Financial Markets Analysis & Forecasting online publication.