


Unmasking China, the Asian Giant
Economics / China Economy Jul 03, 2012 - 03:45 AM GMTBy: Frank_Holmes

 Chinese operas have been keeping audiences enthralled for hundreds of years with mythical characters, enchanting stories and elaborate masks that add drama and mystery. While this fantastical treatment is appreciated in the theatre, it isn't in global markets. Investors don't like mystery--think of how uncertainty has spooked markets in recent years.
Global investors are rarely privy to every detail about the economy; that's why it's necessary to rely on multiple data and research to make decisions and be cautious of extreme views that unnecessarily arouse suspicion, skepticism, and criticism. These opinions may grab headlines, but rarely do they help investors' portfolios.
A recent article in The New York Times raised doubts about the quality in China's macroeconomic reporting. The Times pointed to evidence from "prominent corporate executives in China and Western economists" who say that "local and provincial officials are falsifying economic statistics to disguise the true depth of the troubles." The author alarmed many of our readers, so we immediately contacted numerous analysts--many of whom have front row seats to Chinese economic data--to get their reaction.
Some analysts preempted our request by independently sending out a rebuttal, including CLSA's China Macro Strategist Andy Rothman, in his Sinology report titled, "Lies, Damned Lies..." Since 2006, global investors have come to rely on this company's coverage of China because of its ability to "independently monitor mainland economic activity." See Andy's insightful views on China from a recent webcast.
Don Straszheim from ISI also emailed his view on the veracity of Chinese data. (We note that Don was correct on a recent call on China. When he visited our office at the beginning of June, he correctly predicted the interest rate cut, which China made two days after his visit.)
We're all influenced by emotions, of course, and when used to our advantage, can help guide how we invest. However, we need to be aware of how outside biases can influence our judgment. In Thinking, Fast and Slow, Daniel Kahneman writes about a mechanism through which biases flow called an "availability cascade," a term coined by Cass Sunstein and Timur Kuran. Kahneman says the availability cascade is a "self-sustaining chain of events, which may start from media reports of a relatively minor event and lead up to public panic and large-scale government action." The vicious cycle goes like this: As people begin to worry, they seek more information and are attracted to similar news reports, which encourages additional coverage. The "availability entrepreneurs" are the ones who deliberately want to keep the negative news flowing.
This may not have been the intention of the Times--and other China bears--but its business is selling newspapers.
Kahneman focuses his discussion on how policies should take into consideration a combination of "experts' knowledge with the public's emotions and intuitions." This thinking also relates to investment decisions, which is why our SWOT model is designed to help us review a variety of sources, along with emotion and intuition, and categorize the results in terms of strengths, weaknesses, opportunities and threats.
We encourage our readers to take this approach: Read the Times article and analyze it alongside what analysts are saying:
It's not breaking news that China's data is less-than-perfect. Analysts have been saying this for years. CEBM says simply that the Times article is "a true but not new story," while ISI believes "the shortcomings of China data is a topic every China macro journalist writes on every year or so - with small variations and supporting anecdotes."
Part of the reason the topic of China's "disguise" keeps coming up stems from the fact that the country has not had a very long history of "professional independence from the political machinery in Beijing," says ISI. Unlike developed countries, ISI believes China's data system continues to be opaque and primitive. The countries' inadequacies are relatively common among emerging markets, as numerous analysts have pointed out.
This fact does not release China from its responsibility to make sure that investors have accurate information. Rather, because the country has become an economic powerhouse, it is under greater scrutiny, which means it needs to improve its checks and balances. CLSA says the central government has been aware of how local officials inflate their data and "has been taking steps to mitigate the problem." For example, more than 700,000 companies now report their data directly to the National Bureau of Statistics, rather than the local governments. NBS data is typically used to forecast consumption of key commodities, says CLSA.
The Times discussed how electricity production and consumption is "a telltale sign of a wide variety of economic activity" and is a "gold standard" for finding out how the economy is doing. A few months ago, U.S. Global's analyst, Xian Liang talked about how important electricity consumption was as a measure of activity--some commercial banks that lend to small companies would physically check the meters themselves.
As shown in the chart below, over the last few years, China has reported electricity consumption that was much more volatile than real GDP data. Noting the extreme at the end of 2008, it's likely that GDP fell more than was reported, and at the end of 2009, GDP likely rose more than publicly reported, says ISI.
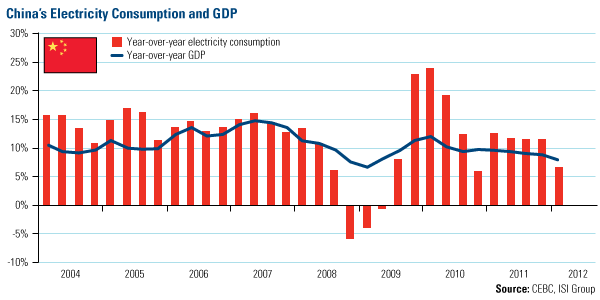
However, the logic of the Times article to think that local officials are "overstating" data seems misguided. According to Bank of America-Merrill Lynch, China's local officials have little incentive to over-report the use of energy because "Beijing imposes increasingly restrictive regulations on energy use per unit of GDP on local governments." Also, since 2011, many local officials have been trying to encourage the government to ease tightening measures, so it is not in their interest to over-report power data to mask a slowdown.
What's needed before investing in any emerging market is an ability to decipher the mountain of data and use informed judgment. Because "all data in China are not created equal," ISI bases its opinion on data, giving more credibility to data that is independent and discounts data that is confusing or biased. Data including purchasing managers' index, export and import volumes, auto and vehicle sales and production, transportation and People's Bank of China are generally high-quality and credible, says ISI.
There's no denying the importance of China. Take a look at McKinsey's map showing the rapid shift in the world's economic center of gravity. Beginning in AD 1, for nearly 2,000 years, the economic center of gravity was in Asia because population growth and migration were slow. Industrialization and urbanization in Europe and the U.S. quickly shifted the economic power west for the next century. Now, "China is urbanizing on 100 times the scale of Britain in the 18th century and at more than ten times the speed," says McKinsey.
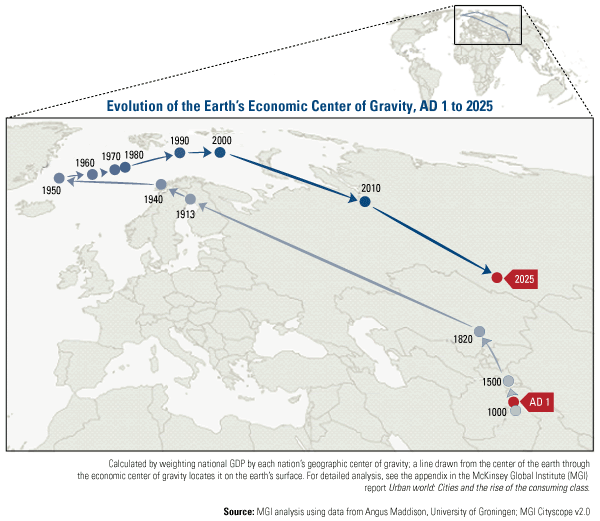
In fact, in the past three years, a combination of lower growth in the developed countries, combined with the fast urbanization of the emerging world, the economic power has reverted back toward the east at the "fastest rate of change" in history.
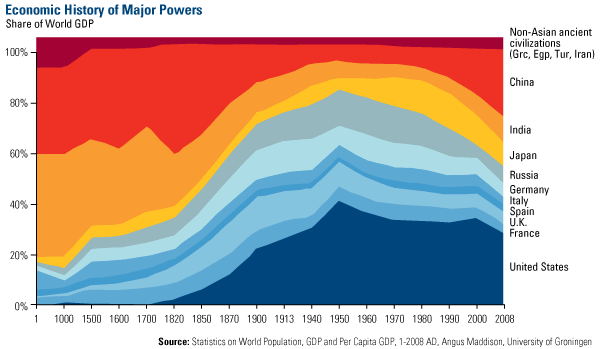
Here's another way to visualize China's reversion to the mean, which we showed a few days ago:
All the World's Not a Stage
China is far from perfect: While actors can perfect their lines and use masks to captivate an audience, smart investors know better to use a wealth of information across numerous sources to guide investment decisions. Weigh the evidence and judge for yourself. As my friend, Investment Strategist Keith Fitz-Gerald said in an interview, "A powerful China is coming, and we have two choices. Either we're at the table, or we're on the menu." To him this means, "Good news from China is good news for the U.S.; bad news from the Chinese economy is bad news here."
For more updates on global investing from Frank and the rest of the U.S. Global Investors team, follow us on Twitter at www.twitter.com/USFunds or like us on Facebook at www.facebook.com/USFunds. You can also watch exclusive videos on what our research overseas has turned up on our YouTube channel at www.youtube.com/USFunds.
By Frank Holmes
CEO and Chief Investment Officer
U.S. Global Investors
U.S. Global Investors, Inc. is an investment management firm specializing in gold, natural resources, emerging markets and global infrastructure opportunities around the world. The company, headquartered in San Antonio, Texas, manages 13 no-load mutual funds in the U.S. Global Investors fund family, as well as funds for international clients.
All opinions expressed and data provided are subject to change without notice. Some of these opinions may not be appropriate to every investor.
Standard deviation is a measure of the dispersion of a set of data from its mean. The more spread apart the data, the higher the deviation. Standard deviation is also known as historical volatility. All opinions expressed and data provided are subject to change without notice. Some of these opinions may not be appropriate to every investor. The S&P 500 Stock Index is a widely recognized capitalization-weighted index of 500 common stock prices in U.S. companies. The NYSE Arca Gold BUGS (Basket of Unhedged Gold Stocks) Index (HUI) is a modified equal dollar weighted index of companies involved in gold mining. The HUI Index was designed to provide significant exposure to near term movements in gold prices by including companies that do not hedge their gold production beyond 1.5 years. The MSCI Emerging Markets Index is a free float-adjusted market capitalization index that is designed to measure equity market performance in the global emerging markets. The U.S. Trade Weighted Dollar Index provides a general indication of the international value of the U.S. dollar.
Frank Holmes Archive |
© 2005-2022 http://www.MarketOracle.co.uk - The Market Oracle is a FREE Daily Financial Markets Analysis & Forecasting online publication.