


Gold Warning Potential Topping Pattern
Commodities / Gold & Silver Feb 17, 2008 - 11:31 AM GMTBy: Merv_Burak

 Is gold taking a rest and moving sideways or is it preparing for a significant move lower, or higher. Where's that coin? Time for the flipping. It will probably be as accurate as anyone.
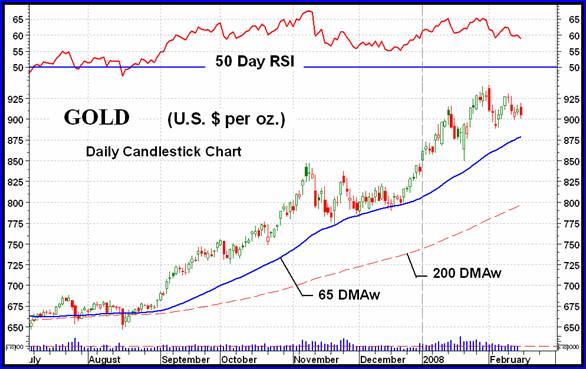
GOLD : LONG TERM - Long term technical indicators and trend changes very slowly so over the past week there was little or no change to the charts or indicators. The long term P&F chart basically has not moved. It is, however, showing a topping pattern as the Xs have hit the $930 level two times now without a penetration.
The direction of the chart is now to the down side but it is still some distance from giving a reversal signal. At the present time that reversal signal would not come into play until a drop to the $840 level takes place. Any further up and down direction changes would change that reversal price level. For now there is no worry.
Gold is still trading far above its positive sloping long term moving average line. The momentum indicator is well entrenched in its positive zone and the volume indicator continues to move above its positive long term trigger line. I could nuance some of these indicators but why bother. The long term rating remains BULLISH and until the other ratings really collapse there is no problem from the long term standpoint no matter how one nuances the indicators.
INTERMEDIATE TERM
The intermediate term P&F chart shown last week has moved over to the right another notch but is still some distance from any reversal. The $840 is still the level to watch on the P&F chart, unless we get more up and down movement which might lift the break-out point.
The chart shows quite clearly the recent weakening in the gold activity. The one positive that still has not given a warning is the moving average line, which is still moving upward below the gold price. As for the momentum indicator, many signs of weakening here. Although we seem to have an upward sloping right shoulder of a head and shoulder pattern in the price action, the momentum action has this pattern as a negative sloping right shoulder, a weaker indicator. The early Fen momentum low was lower than the previous mid-January one even though the price was much higher in Feb. Now, on Friday's close the momentum is already below its early Feb low while the price seems to be moving sideways. The weakening of the momentum indicator is very often a precursor to the price action, at least it should not be ignored. So, one should be on guard for a possible further negative move in the price. However, the intermediate term rating must remain BULLISH until the action actually does start to decline sufficient to turn the indicators around.
SHORT TERM
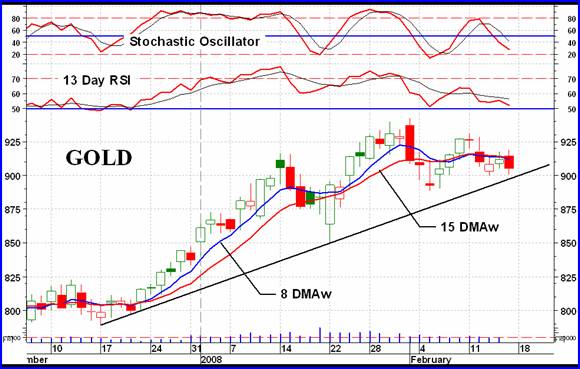
The short term chart shows the weakening in the momentum indicator even better than the other chart did. The only difference between the two momentum charts is that the short term momentum indicator has not moved below its previous low as the intermediate term one has done. Just a minor point. Another day of negative action and the momentum indicator will move below its neutral line into negative territory. It is already below its negative sloping trigger line.
Staying on the topic of momentum, the more aggressive Stochastic Oscillator has already moved into its negative zone and is close to entering its oversold zone. As for the moving average lines, the price is below both its short and very short term moving average lines with both sloping downward. The very short term moving average line has been basically below the short term line for over a week suggesting the direction is towards more weakness in the price. A minor move lower and gold will break below its two month up trend line for a further indication of the price direction. The short term is rated as BEARISH with the immediate term direction of motion continuing downward.
NORTH AMERICAN GOLD INDICES
I mentioned last week that I was slimming down with the the contents of the commentary. I will continue to show the five major North American Gold Indices in rotation each week but will slime down the commentary for each. Today's Index is the S&P/TSX Global Gold Index.
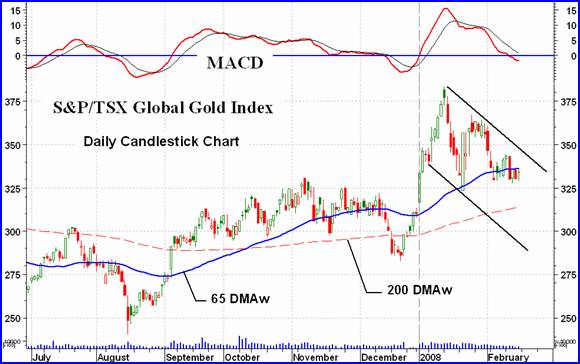
Over the past few years this Index has been one of the poorer performers as far as the major North American Indices are concerned. As their component stocks are not much different than the other Indices one must assume the difference over the past few years was the improvement in the currency value of the Canadian $ versus the U.S. $. Lately, This Index has been performing on a par with the others and there again, the relative currency stability may be the answer.
After a sharp climb the Index has been reacting in a up and down manner with more down than up. The Index is below its intermediate term moving average line although the line has not yet turned downward. With a negative momentum reading and volume action being pretty low, the intermediate term rating can be, at best, classified as – NEUTRAL, one level above a full bear rating.
Long term the Index is still BULLISH.
MERV'S PRECIOUS METALS INDICES
The Composite Index of Precious Metals Indices continues to move lower and has broken below its up trend line from the August low. It has crossed below its negative sloping intermediate term moving average line. The intermediate term momentum indicator, although just very slightly above its neutral line, is heading lower aggressively. The intermediate term can only be rated as BEARISH at this time.
MERV'S GOLD & SILVER 160 INDEX
Although closing higher by 0.2% on the week the Index is still below its negative sloping intermediate term moving average line with a momentum indicator that remains in its negative zone. The intermediate term rating remains BEARISH.
The positive weekly close did not help the winners and losers. There were 61 winners (38%) and 91 losers (57%). The summation of individual stock ratings changed very little with all three time periods in the BEAR camp.
Although the emphasis may change from week to week between the three sector groups one thing is certain, the majority of gold and silver stocks are not in good shape.
MERV'S QUAL-GOLD INDEX : MERV'S SPEC-GOLD INDEX : MERV'S GAMB-GOLD INDEX
This week, the higher the quality the poorer the performance. The Qual-Gold Index lost 1.3% on the week while the Spec-Gold Index gained 0.1% and the Gamb-Gold Index gained 2.7%. The weekly winners versus losers went the same way although all were in the majority losers side. As for the summation of individual stock ratings, the only rating that was in the BULL side was the long term Qual-Gold rating. All others were on the BEAR side or were NEUTRAL.
SILVER
Silver has once more performed better than gold during the week, with a loss of 0.9% versus gold loss of 2.4%. From the table silver has been the best performer of the table components in the short and intermediate term and number 4 for the long term. It has had a very good run since its August low and does not yet seem ready to roll over and play dead. It is still rated as BULLISH for all three time periods.
MERV'S QUAL-SILVER INDEX : MERV'S SPEC-SILVER INDEX
As with the gold Indices, the quality did worse than the speculative Index. The Qual-Silver Index lost 1.8% on the week while the Spec-Silver Index gained 1.2%. The winners and losers were primarily on the loser's side for the Qual Index while for the Spec Index they were about 50/50. Except for a couple of NEUTRAL ratings, the summation of individual stock ratings were in the BEAR camp.
Merv's Precious Metals Indices Table
Well, I'm calling it another day.
By Merv Burak, CMT
Hudson Aero/Systems Inc.
Technical Information Group
for Merv's Precious Metals Central
Web: www.themarkettraders.com
e-mail: merv@themarkettraders.com
Before you invest, Always check your market tirming with a Qualified Professional Market Technician
For DAILY Uranium stock commentary and WEEKLY Uranium market update check out my new Technically Uranium with Merv blog at www.techuranium.blogspot.com .
During the day Merv practices his engineering profession as a Consulting Aerospace Engineer. Once the sun goes down and night descends upon the earth Merv dons his other hat as a Chartered Market Technician ( CMT ) and tries to decipher what's going on in the securities markets. As an underground surveyor in the gold mines of Canada 's Northwest Territories in his youth, Merv has a soft spot for the gold industry and has developed several Gold Indices reflecting different aspects of the industry. As a basically lazy individual Merv's driving focus is to KEEP IT SIMPLE .
To find out more about Merv's various Gold Indices and component stocks, please visit www.themarkettraders.com and click on Merv's Precious Metals Central . There you will find samples of the Indices and their component stocks plus other publications of interest to gold investors. While at the themarkettraders.com web site please take the time to check out the Energy Central site and the various Merv's Energy Tables for the most comprehensive survey of energy stocks on the internet. Before you invest, Always check your market timing with a Qualified Professional Market Technician
Merv Burak Archive |
© 2005-2022 http://www.MarketOracle.co.uk - The Market Oracle is a FREE Daily Financial Markets Analysis & Forecasting online publication.
Comments
|
Sheri Deen
17 Feb 08, 21:57 |
Grab Gold!
If gold goes down to $8.50 an ounce. grab it. But what will happen when the US Gov't outlaws the personal holding of the metal. |