Reading the Elliott Wave Analysis Market Road Maps
InvestorEducation / Elliott Wave Theory Nov 16, 2012 - 03:21 PM GMTBy: EWI
 (Part 1 of this article is posted here.)
A Quick Road Map of Wave Analysis
For this overview of wave analysis, I have borrowed from the "Cliffs Notes" version that we provide for free to anyone interested in learning about wave analysis. It's called Discovering How To Use the Elliott Wave Principle.
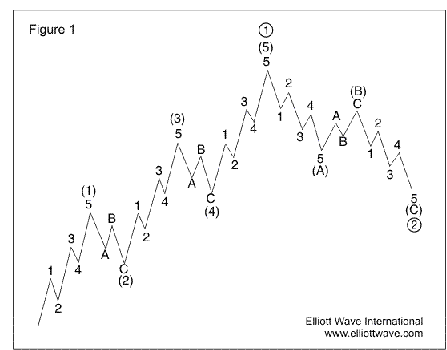
Elliott's road map, or basic wave pattern, consists of "impulsive waves" and "corrective waves." An impulsive wave is composed of five subwaves and moves in the same direction as the larger trend -- or the wave's next larger size. A corrective wave is divided into three subwaves, and it moves against the trend of the next larger degree. As you can see in Figure 1, there are plenty of right and left turns -- or up and down moves on a price chart.

Figure 1 reveals the general roadmap that markets follow during bull markets. Notice the building-block process. The completion of an initial impulsive wave (waves 1-5, up-down-up-down-up) sets the stage for a corrective phase (waves A-B-C, down-up-down). Combined, those waves represent the first two legs of a larger "degree" advance. In this illustration, waves 1, 2, 3, 4 and 5 together complete a larger impulsive wave, labeled as wave (1).
A five-wave rally from a significant low tells us that the movement at the next larger degree of trend is also upward. It also warns us to expect a three-wave correction -- in this case, a downtrend. That correction, wave (2), is followed by waves (3), (4) and (5) to complete an impulsive sequence of the next larger degree. At that point, again, a three-wave correction of the same degree occurs.
Note that, regardless of the size of the wave, each impulsive wave peak leads to the same result -- a correction.
If we isolate the corrective waves, the subwaves A and C move in the direction of the larger trend and usually unfold in an impulsive manner. Referring to Figure 1, the (A)-(B)-(C) decline that follows the (1)-to-(5) sequence illustrates this structure. Waves labeled with a B, however, are corrective waves; they move opposite to the trend of the next larger degree. In this case, they move upward against the downtrend. Notice that these corrective waves are themselves made up of three subwaves.
Reading the Wave Analysis Map
So now that you have a wave road map in hand, let's talk about how to apply it to the actual terrain of financial markets. When I look at a price chart for the first time, my first task is to identify any completed five-wave and three-wave structures. Once I do that, then I can interpret where the market is along the pre-defined path and, from there, where it's likely to go.

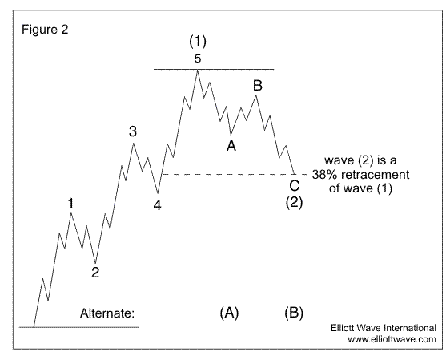
Say we're studying a market that has reached the point shown in Figure 2. So far we've seen a five-wave move up, followed by a three-wave move down.
But this is not the only possible interpretation. It's sort of like having a GPS that tells you that you've arrived, when you've actually got miles to go. In this example, it is also possible that wave (2) hasn't ended yet; it could develop into a more complex three-wave structure before wave (3) gets under way. Another possibility is that the waves labeled (1) and (2) are actually waves (A) and (B) of a developing three-wave upward correction within a larger impulsive downtrend, as shown in the "Alternate" interpretation at the bottom of the chart. According to each of these interpretations, though, the next imminent movement is likely to be upward. That tells you more than most technical analysis systems do.
Alternate counts are an essential part of using the Wave Principle. They are neither "bad" nor "rejected" wave interpretations. Rather, they are valid interpretations that are given a lower probability while the count works itself out. If the market doesn't follow the original preferred scenario, the top alternate usually becomes the preferred count.
I consider alternate counts to be similar to detours -- just a different way for the market to get to where it's going. How many times do you actually go from point A to point B non-stop in your travels? Admit it, you have to stop to grab a bite to eat or ask for directions once you realize you're lost. After consulting the map, you get back on track toward your intended destination. The new path represents an alternate count.
This seeming ambiguity about a wave structure illustrates an important point about the Wave Principle that, in my opinion, is often misunderstood. The Wave Principle does not provide certainty about any one market outcome. Instead, it gives you an objective means of determining the probability of a future direction for the market. At any time, two or more valid wave interpretations usually exist. Unlike actual physical roads that exist, price movements in financial markets are always changing, and the best you can do is be somewhat confident of whether they are moving up or down. That's the kind of confidence that the Wave Principle provides.
(Come back soon for part 3 of this series.)
 Who is Jim Martens? Jim is one of the very few forex Elliott wave instructors in the world, and a long-time editor of EWI's Currency Specialty Service. A sought-after speaker, Jim has been successfully applying Elliott since the mid-1980s, including 2 years at the George Soros-affiliated hedge fund, Nexus Capital, Ltd.
Catch up on Jim's latest thoughts about FX markets and the business of trading them at his Twitter feed.
Download Your Free 14-page eBook: "Trading Forex: How the Elliott Wave Principle Can Boost Your Forex Success" Here's some of what you'll learn:
Jim also takes you through two real-world trading examples to reinforce what you've learned and apply it to your own trading. All you need is a free Club EWI profile to download this FREE 14-page eBook now >> |
This article was syndicated by Elliott Wave International and was originally published under the headline Which Works Best -- GPS or Road Map? (Part 2). EWI is the world's largest market forecasting firm. Its staff of full-time analysts led by Chartered Market Technician Robert Prechter provides 24-hour-a-day market analysis to institutional and private investors around the world.
About the Publisher, Elliott Wave International
Founded in 1979 by Robert R. Prechter Jr., Elliott Wave International (EWI) is the world's largest market forecasting firm. Its staff of full-time analysts provides 24-hour-a-day market analysis to institutional and private investors around the world.
© 2005-2022 http://www.MarketOracle.co.uk - The Market Oracle is a FREE Daily Financial Markets Analysis & Forecasting online publication.


