Gold Price Market Manipulation Proof
Commodities / Gold and Silver 2012 Nov 30, 2012 - 07:30 AM GMTBy: GoldSilverWorlds
 A lot has been written lately about the gold price manipulation and the real amounts of gold reserves of the central banks. There are several views on the same topic, the most rational one being purely statistical. As it’s easy to get caught by emotions, we have chosen in this article to let the figures and the charts tell the story.
As a seasoned mathematician, Dimitri Speck is focused on what the charts are revealing. He looks both into intraday charts as well as seasonal charts, the former being one specific variant of the latter. Based on years of chart analysis, he could clearly pinpoint the manipulation in the gold market. In his book, he explores the subject of gold holdings of the central banks, in particular the Bundesbank. Interestingly, there is a link between all the different topics we just mentioned, which was the topic of our Q&A.
Transparency in Germany’s gold reserves
Dimitri Speck observes that the Bundesbank (German central bank) has to audit the German gold reserves on a regular basis and publish the results. That’s an obligation by German law. It needs to include in their reports for example if the gold has been leased out or if it’s physically there.
The point is that nobody has paid attention to these audits for a long time. A couple of years ago several authors started to question why the Bundesbank didn’t publish the results of their audits. Dimitri Speck was one of them. The question did escalate to some members of the Parliament. In Germany in particular, there is a Court of Auditors that picked up the topic two years ago (i.e. “RechnungsHof”, a special office which controls the public finances). The pressure increased and resulted in a promise by the Bundesbank to provide an answer “soon”. Their answer finally came in October. That’s the background of the whole “affair” that was created in October on Germany’s gold holdings.
Gold price suppression proven by intraday charts
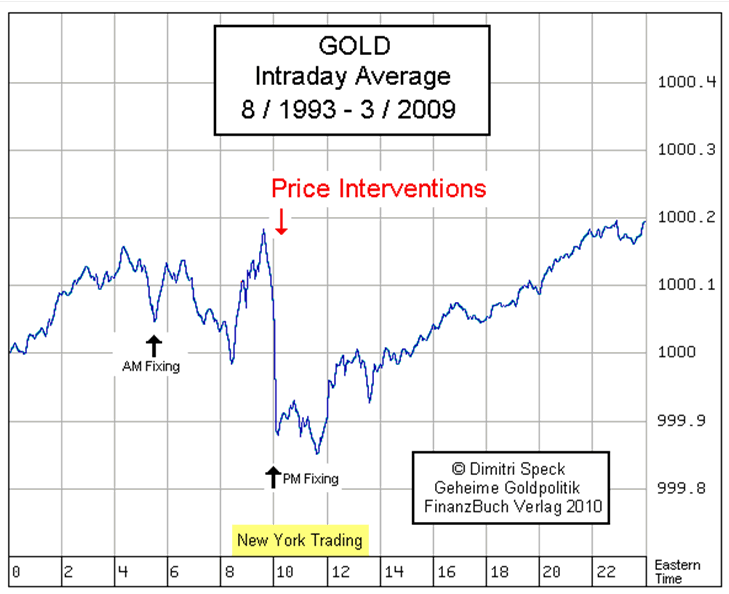
Based on his statistical research, Dimitri Speck concludes that central banks started to influence systematically the price of gold as of August 1993. His conclusion comes in particular from his intraday statistics, where he observed several anomalies. First, since 1993, the price has been falling systematically during the trading session of COMEX in NY. Another trading anomaly is that during the PM fix the price systematically tends to drop significantly.
The following chart is the result of some 16 years of recording intraday data. The sudden price drops are so sharp and systematic, that it can only point to intervention.

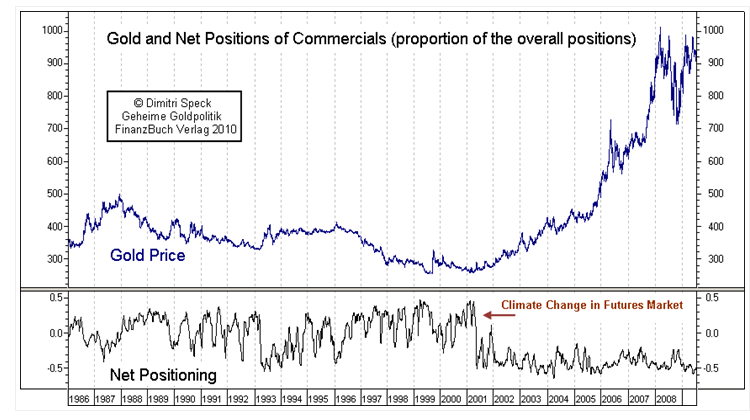
In the internet press, we mostly read that the manipulation is visible in the COT reports. So our question to Dimitri Speck was how those two relate to each other? Now here is it where it gets interesting. It appears that the manipulation in the futures market (visible in the COT reports) comes on top of the revelations on the intraday charts. The point is that the interventionists increased significantly their activities in the futures gold markets in May 2001, what is visible in the COT report. Before that, the price was more suppressed through selling and leasing of gold. As soon as the futures markets got into play, an increasing number of price shocks have appeared with an increasing intensity. Obviously those price changes were mostly drops rather than increases. It becomes clear on the following chart. As of May 2001, the “climate has changed” because of the futures market, which is clearly an anomaly. The decline in the lower part of the chart, that started at that given point in time, shows the net positioning of commercials as a share of total positions. The line is significantly lower, proving that commercials are more on the short side.

So what’s visible on the charts is that, since May 2001, the commercials have reinforced an ongoing trend that started in 1993.
As a sidenote, Dimitri Speck adds that short positions are not the only condition for price suppression. Before 2001, similar price drops did occurr. Shorts are just one of the many influencing factors. For sure they do have an effect, as we saw for instance in the silver market starting 14 months before the peak of May 2nd 2011. During that period, central banks temporarily scaled down their interventions as clearly shown by the intraday charts. It led to the gigantic bull run.
From a supply & demand point of view, during another insightful interview, Mr Speck points to the classical example at the end of 2008. There was so much demand for gold at that time because of the extreme fear levels. Yet the gold price remained low price despite long delivery waiting times. Central bank interventions clearly prohibited the price of gold to rise above the $ 1,000 mark.
Central banks have a double interest in gold
During our discussion, Dimitri Speck pointed to the double interest of the central banks. On one hand, gold cannot rise too fast as it reveals weakness of the central banks’ “product” (i.e. it’s currency) and their balance decrease in value. That’s why the Washington Agreement came to life, created in 1999 after a too sharp decline of the gold price. On the other hand, as central banks are accumulating gold especially in the last years since 2008, they have a vested interest for a higher value of the asset they are accumulating.
Gold almost always reflects a political price. It has never been in a real free market:
- In the 60’s gold had a fixed price.
- In the 70’s gold was subject to serious price suppression (more or less officially recognized).
- In the 80’s only a minor number of interventions have taken place, as there was no necessity to intervene (have a look at the gold price chart to understand this point).
- Starting from August 1993, it marked the era of hidden and systematic price suppressions.
- It is very likely that we’ll continue to see manipulation for a long period of time (decades?).
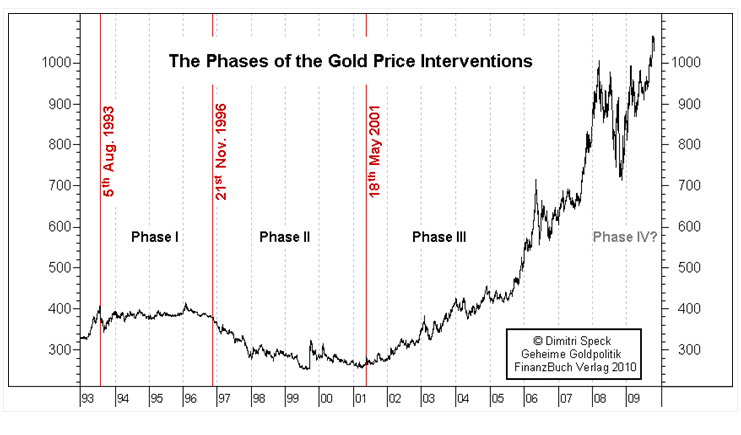
Based on extensive research, Dimitri Speck explains three phases when it comes to central bank interventions in the gold market.

In the first phase, the central banks prevented an increase in price above the threshold of 400 dollars. Phase two was marked by private leasing and lower prices were the result of a desire for profits. Phase three was characterized by a controlled price increase. Although interventions are operated secretly, there is sufficient evidence to prove gold price interventions based on statistical analysis and further evidence
On the question which means are used to intervene, Dimitri Speck explained during an interview with Lars Schall that it happens in three ways. First, gold is being sold in the market creating artificial supply. Second, gold is being leasing via the bullion dealers like JP Morgan or HSBC amongst others. That practice mainly started in August 1993 and has the same effect as selling. Although these two two practices are being applied less than before, the third manipulation tactic has gained “popularity”. Sudden shocks are created by selling large quantities in order to influence the behavior of investors.
What will the future bring for gold
In case the financial system will not collapse and we continue at the current pace of inflation below 10%, we could see a gold price 10 times higher even with the ongoing interventions. In a similar way the price increase has been controlled from $ 250 to $ 1,900. It’s a matter of not allowing the gold price to rise too fast. Only if the markets gain control over the money system as the result of for instance much higher inflation rates, the gold price could rise in an uncontrolled way (like the rise of the inflation rate in the 70’s for instance, which was the result of distrust in the monetary system). Currently we don’t see such an event on the horizon, at least it’s not visible yet. That doesn’t tell anything about the future: such an event might occur in 2 years or in 20 years, or even never.
It might happen that central banks change their mind and set a higher gold price in order to stabilize the currency system or their balance sheets. That’s indeed a kind of a gold standard. Here again, it is potentially in the cards but it’s not visible on the horizon.
Mind that a gold standard as such will not solve the over-indebtedness we are currently facing. Once in the indebtedness is “solved” however, gold can play a role in limiting the credit bubbles. Excessive spendings by politicians is the core issue. A gold standard is one of the means to keep that behavior under control.
The future is open and the point is that there are many possible outcomes. One thing is for sure however. In an indebted world it will take a lot of time to see get normal debt levels again. Only with a much lower indebtedness we can return to a stable system again.
Speaking about the future, Dimitri Speck does not hold high expectations about the upcoming Basel III implementation. He asks loudly whether the new regulation will not bring more problems. Although it’s for sure a good idea to limit the credit to the economy, the fact of having yet more regulation could be distracting. As the financial system is too complicated, less but more strict rules could be a better solution, he says.
GoldSilverWorlds had the honour to do a Q&A with Dimitri Speck who is the author of the best-selling book “Geheime Goldpolitik”. He is chief financial engineer of Staedel Hanseatic and runs SeasonalCharts.com, offering a wealth of intraday trend charts. He is also one of the people who increased the pressure to create transparency in the German’s gold holdings.
© 2012 Copyright goldsilverworlds - All Rights Reserved Disclaimer: The above is a matter of opinion provided for general information purposes only and is not intended as investment advice. Information and analysis above are derived from sources and utilising methods believed to be reliable, but we cannot accept responsibility for any losses you may incur as a result of this analysis. Individuals should consult with their personal financial advisors.
© 2005-2022 http://www.MarketOracle.co.uk - The Market Oracle is a FREE Daily Financial Markets Analysis & Forecasting online publication.


