Commodity Resource Stock Investors Can Expect Sunnier Days Ahead
Commodities / Resources Investing Jan 29, 2013 - 08:47 AM GMTBy: Frank_Holmes
 During the current commodity supercycle, there have been occasions--too many to count--when investor psyche has been damaged by reports about slowing U.S. growth, a hard landing in China or a debt crisis in Europe. Yet just behind the gloom, significant and positive trends are taking hold, causing the storms to start dissipating.
I often say that government policies are precursors to change, which is why we follow the monetary and fiscal actions closely as they can have a significant impact on asset prices. You have to go back about 16 months when Brazil kicked off the latest global easing cycle by cutting interest rates by 50 basis points. Since then many developing countries such as the Philippines, China and Colombia, as well as developed nations of Japan, the European Central Bank, the U.S. and the U.K. have joined forces in a world-wide synchronized stimulation of the economy.
Last summer, Mario Draghi indicated that the ECB would do "whatever it takes" to save the euro. In the fall, the Federal Reserve agreed to buy $85 billion a month in Treasuries and mortgages, amounting to $1 trillion a year. And just recently, Japan announced that, in addition to pumping $1.1 trillion into the markets through 2013, the central bank will keep an open-ended approach to buying assets through 2014.
Historically, central banks' policy actions occur after there's been some economic deterioration. Several months later, the stimulative measures work their way through the global economy.
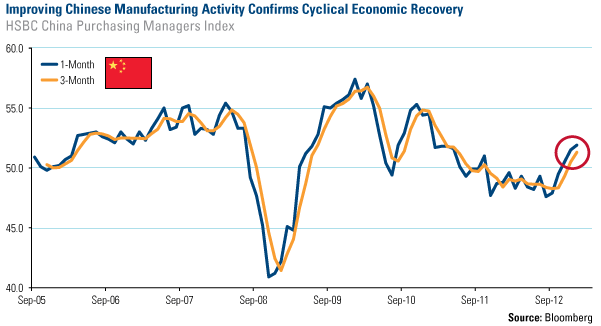
This has been the case with China, which has been showing remarkable improvement in its export-oriented HSBC Purchasing Managers Index. The PMI is a measure of health of companies in China, as it includes output, new orders, employment and prices across numerous sectors.
This month, the Flash PMI came in at 51.9, beating market consensus, which was at 51.7. The PMI stands at a two-year high, as you can see in the chart below.

A few months ago, when China's improving PMI was just beginning to attract attention, I talked with Peter Gibson and Randy Cass from Canada's Business News Network, who were skeptical of the data because of the slowdown in Europe, China's largest trading partner. I indicated that although Europe's deceleration negatively affected China, there were other underlying positive factors taking place. In addition to the continuous stimulus program happening in the countries, China's new leadership had been solidified. I believed that these dynamics would help PMI accelerate and exports to pick up.
PMIs are leading indicators for global resources stocks, which have lagged over the past year. In 2012, the Morgan Stanley Commodity Related Index only increased 1.4 percent. However, this year, the index is off to an incredible start, rising more than 8 percent in only four weeks.
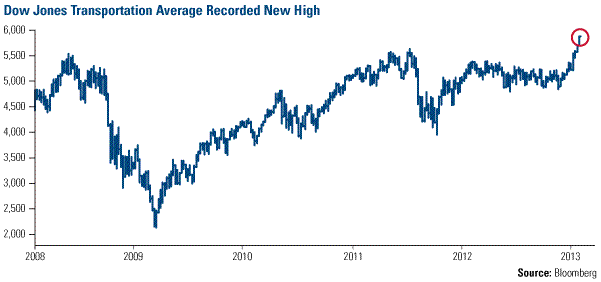
Stocks across a number of cyclical areas of the market have benefited from this global improvement, including industrial companies such as trucking, rail and airlines. Take a look below at a classic cyclical measure of the market, the Dow Jones Transportation Average, or Dow Jones Transports. The index, an average of 20 transportation companies in the U.S., reached an all-time high last week.

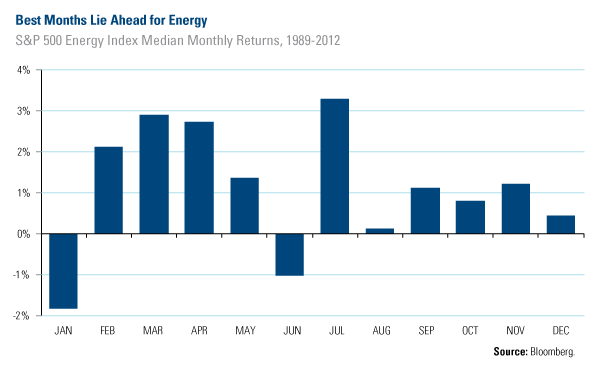
In addition to the synchronized stimulus driving resources, we are entering the time of year that has historically been good for energy equities. Looking at two decades of seasonal patterns of companies in the S&P 500 Energy Index, the next six months have historically been the best of the year. While energy stocks typically decline in January, they have seen positive results in February, March, April and May. July has historically been the best month for energy stocks, climbing more than 3 percent on a median return basis.

It seems clear that there are a number of investors who have gained confidence in the global economy and are seeking to capture the growth opportunities taking place around the world. With the European crisis comfortably in the rear view mirror and global central banks taking the position that they will continue their easing policies, investors have taken their foot off the brake and have begun to accelerate.
As we've been consistently communicating in presentations lately, we see more sunshine and less stormy weather ahead. Take advantage of these momentous and seasonal shifts and make sure you have an appropriate allocation to equities poised to benefit, such as global natural resources stocks. As a benchmark weighting for investors, the energy and materials sectors make up 15 percent of the S&P 500 Index.
A caveat to these sunnier days is the U.S. debt ceiling issue. In managing expectations going forward, we likely will see volatility not unlike the ups and downs of the last four years. However, every dip has historically been a buying opportunity. With many investors now considering equities today, future dips are likely to be opportunities to buy as well.
For more updates on global investing from Frank and the rest of the U.S. Global Investors team, follow us on Twitter at www.twitter.com/USFunds or like us on Facebook at www.facebook.com/USFunds. You can also watch exclusive videos on what our research overseas has turned up on our YouTube channel at www.youtube.com/USFunds.
By Frank Holmes
CEO and Chief Investment Officer
U.S. Global Investors
U.S. Global Investors, Inc. is an investment management firm specializing in gold, natural resources, emerging markets and global infrastructure opportunities around the world. The company, headquartered in San Antonio, Texas, manages 13 no-load mutual funds in the U.S. Global Investors fund family, as well as funds for international clients.
All opinions expressed and data provided are subject to change without notice. Some of these opinions may not be appropriate to every investor.
Standard deviation is a measure of the dispersion of a set of data from its mean. The more spread apart the data, the higher the deviation. Standard deviation is also known as historical volatility. All opinions expressed and data provided are subject to change without notice. Some of these opinions may not be appropriate to every investor. The S&P 500 Stock Index is a widely recognized capitalization-weighted index of 500 common stock prices in U.S. companies. The NYSE Arca Gold BUGS (Basket of Unhedged Gold Stocks) Index (HUI) is a modified equal dollar weighted index of companies involved in gold mining. The HUI Index was designed to provide significant exposure to near term movements in gold prices by including companies that do not hedge their gold production beyond 1.5 years. The MSCI Emerging Markets Index is a free float-adjusted market capitalization index that is designed to measure equity market performance in the global emerging markets. The U.S. Trade Weighted Dollar Index provides a general indication of the international value of the U.S. dollar.
Frank Holmes Archive |
© 2005-2022 http://www.MarketOracle.co.uk - The Market Oracle is a FREE Daily Financial Markets Analysis & Forecasting online publication.


