


Gold Continues to Work Through Consolidation
Commodities / Gold and Silver 2013 Mar 11, 2013 - 08:17 PM GMT

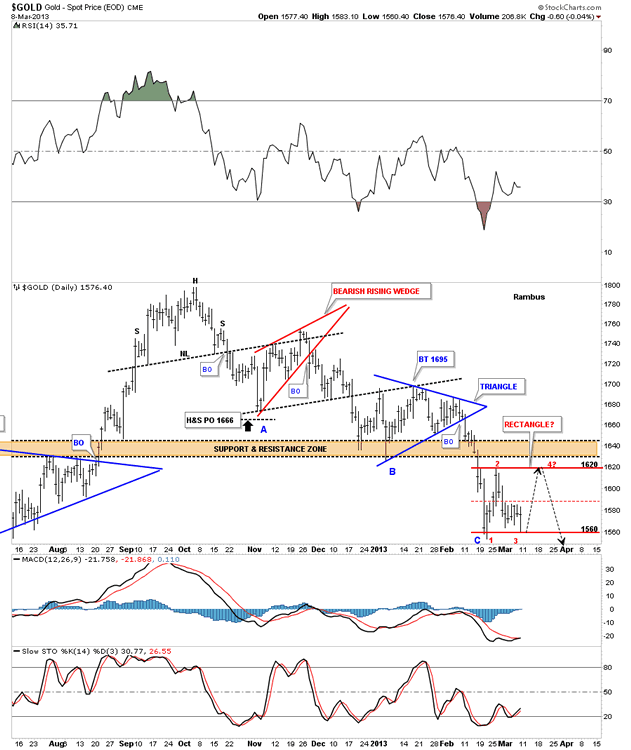
 Tonight’s chart is a daily bar chart for gold that shows all the consolidation patterns since hitting the top of the rectangle back in October of last year at 1800 or so. If gold was ready to break below the bottom rail of the big rectangle, today would have been a good time to do so. Because it didn’t breakdown this morning that tells me the sideways correction that has been going on already for almost 3 weeks now, still has more work to do. Below shows what I think could be a smaller red rectangle that is forming below the brown shaded support and resistance zone that may end up being just one more consolidation pattern to the downside.
The possible red rectangle is about 60 points and with today’s close around 1575 or so would leave about 45 more point to go to reach the top rail. At our most recent bottom there have been 3 main declines out of the H&S top and the two consolidation pattern. This is a good example of how a downtrend works. It starts out with a top that breaks down hard and then a consolidation pattern forms and then when its finished you get another hard down and so on until you get a reversal pattern form at the bottom. I’ve labeled these 3 hard down phases A B & C.
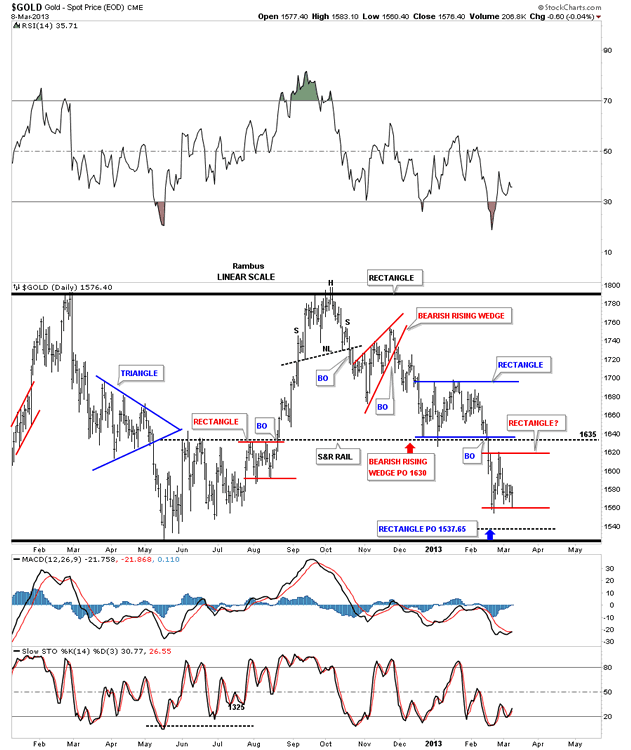
This next chart is another daily chart that goes out a little further out in time that shows the top and bottom rails of the large rectangle gold has been in for 18 months or so.
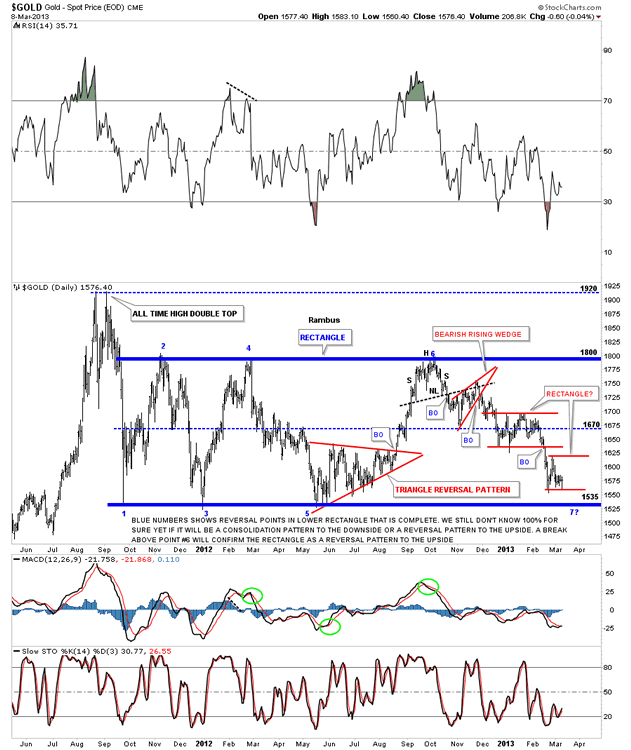
This next long term daily chart shows the big trading range, blue rectangle, and our latest decline towards the bottom.
The next chart is a long term weekly look that goes all the way back to the 2008 crash low. This chart gives you a good look at our big Blue rectangle that I think is going to eventually break to the downside. Until it does its still consolidating.
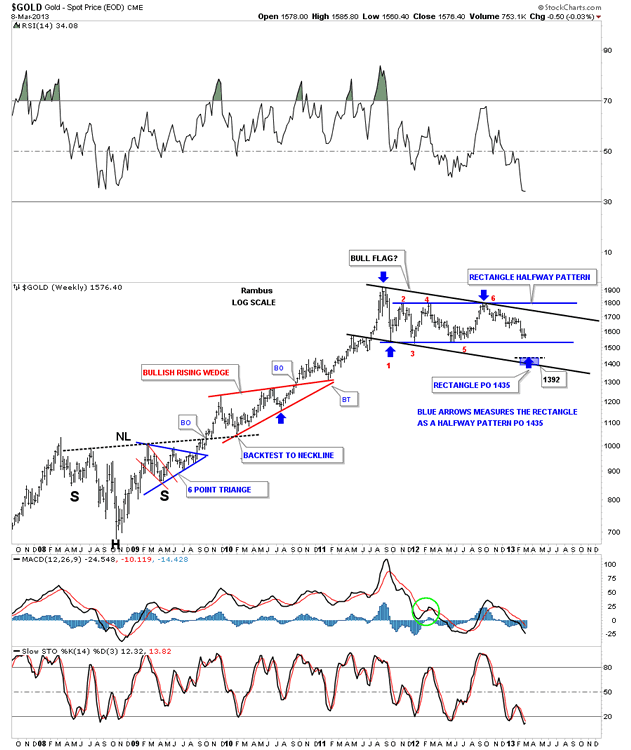
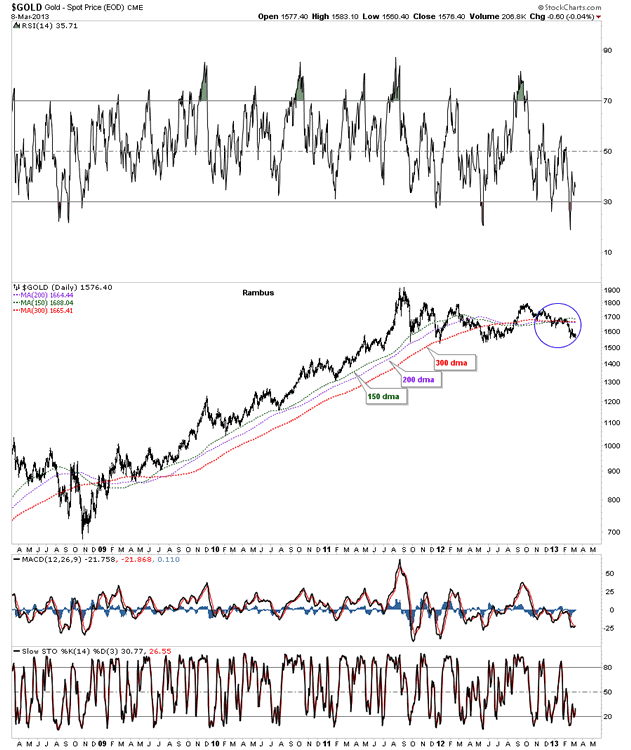
This last chart shows what I consider the most important moving averages on the daily look. As you can see the price action is trading well below all three moving averages which is a negative.
This should get everyone up to speed on how gold is trading. I don’t really expect much action until the smaller rectangle is finished forming. All the best…Rambus
Editors Note:
Rambus Chartology is a Precious Metals Based Technical Analysis Site with a twist
“Give a Man a Chart and he can eat for a day : Teach a man To Chart and He will never Starve”
More at www.rambus1.com
LIMITED TIME FREE TRIAL - http://rambus1.com/?page_id=10
Rambus Chartology is Primarily a Goldbug TA Site where you can watch Rambus follow the markets on a daily basis and learn a great deal of Hands on Chartology from Rambus Tutorials and Question and Answers.
Most Members are Staunch Goldbugs who have seen Rambus in action from the 2007 to 2008 period at www.goldtent.org and now Here at Rambus Chartology since early 2012.
To review his Work and incredible calls from the 2007-2008 period click on the top right sidebar in the "Wizard of Rambus” ..."What If !!" Post
To Follow Rambus Unique Unbiased Chart Work and participate in a Chartology Form with questions and answeres and learn the Art and Science and Mindset of a Pro Trader please Join us by subscribing monthly for $29.99 at www.rambus1.com
© 2013 Copyright Rambus_Chartology
- All Rights Reserved
Disclaimer: The above is a matter of opinion provided for general information purposes only and is not intended as investment advice. Information and analysis above are derived from sources and utilising methods believed to be reliable, but we cannot accept responsibility for any losses you may incur as a result of this analysis. Individuals should consult with their personal financial advisors.
© 2005-2022 http://www.MarketOracle.co.uk - The Market Oracle is a FREE Daily Financial Markets Analysis & Forecasting online publication.