


Stock Market Expected to Trend Lower Into April 08
Stock-Markets / US Stock Markets Mar 10, 2008 - 03:06 AM GMTBy: Andre_Gratian

 Current Position of the Market
SPX: Long-term trend - Election years that fall in the 8th year of the Decennial pattern call for consolidation in the early part of the year followed by a strong finish. But the 6-yr cycle which is scheduled to bottom in late Summer/early Fall could also play a restraining role, followed by an eventual bull market top in 2009-2010.
SPX: Intermediate trend - an extended intermediate-term consolidation is in process with a potential low in mid-April.
Analysis of the short-term trend is done on a daily basis with the help of hourly charts. It is an important adjunct to the analysis of daily and weekly charts which determines the course of longer market trends.
Overview
According to the decennial pattern, the current intermediate downtrend should end in the early part of the year and the long-term uptrend should resume and peak in 2009 or 2010. So far, we appear to be on course for this scenario. It looks as if we may have started a 5th wave down from the top, and an important cycle is due to make its low in April. After 5 waves in one direction, the market normally has a reversal. Bottoming cycles also bring about reversals.
And if this reversal does not resume the uptrend? Then we may keep on going down or sideways into the Fall when several important cycles are scheduled to make their lows.
Or, if we decline into the Fall and cannot get back in an uptrend to make new highs? Then, it is likely that the very long-term cycles that are due to make their lows in 2012-14 have already taken over, that the Decennial pattern will fail for the first time in over a hundred years, and that the economy is going to go into a massive recession if not depression.
Some very good analysts believe that this last scenario has already begun. Could be, but it's a little premature to jump to this conclusion. This is something that will only be revealed as it unfolds, and we should at least wait until we see what kind of a rally we have after mid-April. As of now, the SPX has retraced exactly .382 of its move from October 2002. If we are making a wave 5 down from 1576, we will go a little lower, but it would still be well within the confines of a normal correction for the bull market which started in 2002.
What's ahead?
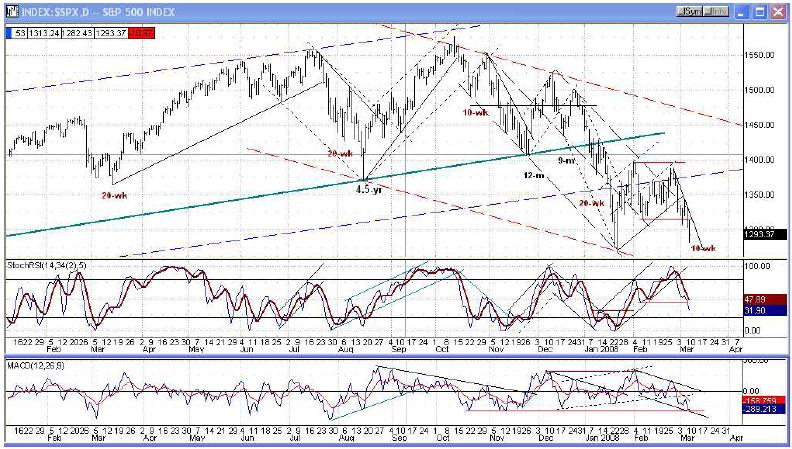
Momentum: The intermediate indicators are oversold and searching for a bottom. The short-term ones are still declining, as you can see on the chart which follows. The A/D oscillator (below) is as oversold as it was since last October, but the momentum oscillator still has a ways to go.
Last week was the closest the SPX came to challenging the January low and with the 10-wk cycle low shortly ahead of us and the 9-mo in about 4 to 5 weeks, we will probably make a new low before the decline is over. Three of the major indices have already made new lows for the year.
I have outlined in red what I think is the current profile of the correction. If we should drive below the lower trend line over the next few weeks, it would be considered a negative, as it would indicate that we are going into a steeper trend. We already have indication of weakness in that the last rally could not overcome the previous high, could barely move above the blue line before retracing, and did the same with the down channel.
Returning strength would come in the form of price deceleration, remaining well away from the lower red channel line, and an improvement in the A/D leading to relative strength.
Cycles: As mentioned previously, the 2-yr and 6-yr cycles are due in the Fall. There may also be a 7- yr cycle at play here (1987-1994-2001-2008?). These could be offset by the seasonal pattern of an election year which calls for a correction in the early part of the year followed by a resumption of the bull market. The end of the seasonal pattern could be marked by the bottoming of the 9-mo cycle which is due in April.
Judging by the amount of weakness which is brought about when short-term cycles make their lows, there is still plenty of downside pressure in the market. The 6-wk cycle probably made its low this past week and brought plenty of price weakness with it, and the 10-week is due to bottom toward the end of next week -- ideally! The past two phases ran about 11 weeks each and if this one does also, it could be pushed closer to the end of the month.
Another date of interest is March 22. This is the next Martin Armstrong business cycle date which has frequently had an impact on the stock market in the past, but since it comes as a CIT (change in trend) one never knows if it will turn out to be a high or a low. If the 10-wk cycle bottoms next week, it will probably be a high this time. If the 10-wk cycle is late again, it could make its low on March 22.
Projections: The first phase of the rally to 1396 fulfilled a Point & Figure projection derived from the second phase of the base made at the January lows. The entire base had a count to 1424 which was never filled because the last rally failed to surpass the former high -- a sign of weakness.
Friday's decline reached the given projection of 1285-95, rallied sharply, had another drop to 1283, and rallied again to close at 1293. Since the projection was met and subsequently tested, we can probably assume that the 6-wk cycle has bottomed. However, there could be some backing and filling before starting up and there is no way to estimate the extent of the up-wave until that process is complete, but if the 10-wk cycle does make its low at the end of next week, we can probably assume that the rally will not amount to much.
Breadth: On Friday, the hourly A/D showed substantial positive divergence to the price pattern, suggesting that we had made a low. However, the daily A/D oscillator has just touched the low of its current range and could bounce from there, but it is still in a downtrend channel. Until it shows some positive divergence and/or comes out of its downtrend, we can assume that the price low for the move from 1388 has not yet been seen.
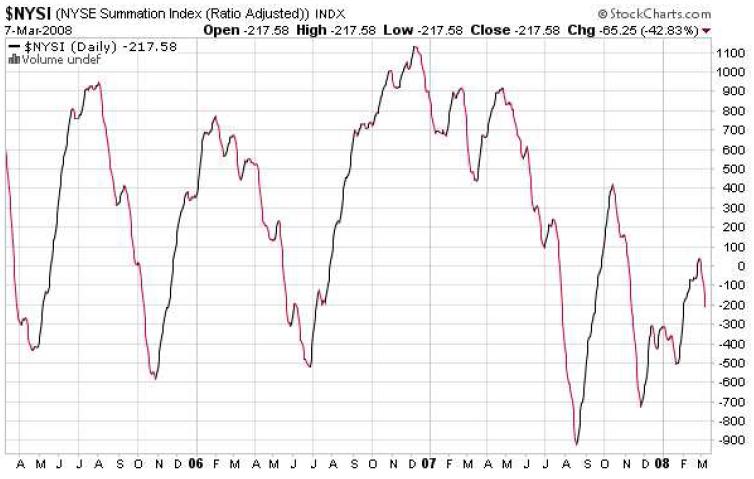
The McClellan Summation Index below (courtesy of StockCharts) has turned down after reaching the zero line. The fact that it was not able to get positive is a sign of market weakness which tells us that the intermediate decline has not bottomed. However, the fact that it has been demonstrating positive divergence to the SPX since January is a sign of relative strength and an indication that we are probably approaching the low of the decline.
Market Leaders and Sentiment
GE made a new low for the year last week. This is not a good sign, unless it can make a higher low if and when the SPX makes a new low in April. Same with the NDX!
The Banking index also declined sharply last week thereby eliminating a potential H&S reversal pattern. However, it remained above its former low.
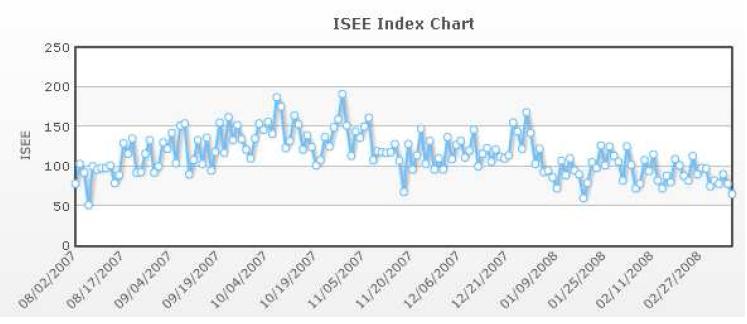
The AAII and ISEE (below) remain potentially bullish, while the Investors Intelligence has come down from very bearish to neutral.
Summary
The SPX still appears to be on track for an intermediate low in the next few weeks. The 9-mo Hurst cycle due about mid-April would be a good time-target for that low.
If the index is not able to get back into a strong uptrend after this low, the correction could be extended into the Fall.
A market advisory service should be evaluated on the basis of its forecasting accuracy. This is probably the best all-around value. Two areas of analysis that are unmatched anywhere else - - cycles and coordinated Point & Figure and Fibonacci projections -- are combined with other methodologies to bring you weekly reports and frequent daily updates.
The following are examples of unsolicited subscriber comments:
What is most impressive about your service is that you provide constant communication with your subscribers. I would highly recommend your service to traders. D.A.
Andre, You did it again! Like reading the book before watching the movie! B.F.
I would like to thank you so much for all your updates / newsletters. as i am mostly a short-term trader, your work has been so helpful to me as i know exactly when to get in and out of positions. i am so glad i decided to subscribe to turning points. that was one of the best things i did ! please rest assured i shall continue being with turning points for a long while to come. thanks once again ! D.P.
But don't take their word for it! Find out for yourself with a FREE 4-week trial. Send an email to ajg@cybertrails.com .
By Andre Gratian
MarketTurningPoints.com
A market advisory service should be evaluated on the basis of its forecasting accuracy and cost. At $25.00 per month, this service is probably the best all-around value. Two areas of analysis that are unmatched anywhere else -- cycles (from 2.5-wk to 18-years and longer) and accurate, coordinated Point & Figure and Fibonacci projections -- are combined with other methodologies to bring you weekly reports and frequent daily updates.
“By the Law of Periodical Repetition, everything which has happened once must happen again, and again, and again -- and not capriciously, but at regular periods, and each thing in its own period, not another’s, and each obeying its own law … The same Nature which delights in periodical repetition in the sky is the Nature which orders the affairs of the earth. Let us not underrate the value of that hint.” -- Mark Twain
You may also want to visit the Market Turning Points website to familiarize yourself with my philosophy and strategy.www.marketurningpoints.com
Disclaimer - The above comments about the financial markets are based purely on what I consider to be sound technical analysis principles uncompromised by fundamental considerations. They represent my own opinion and are not meant to be construed as trading or investment advice, but are offered as an analytical point of view which might be of interest to those who follow stock market cycles and technical analysis.
Andre Gratian Archive |
© 2005-2022 http://www.MarketOracle.co.uk - The Market Oracle is a FREE Daily Financial Markets Analysis & Forecasting online publication.