


Stock Market Uptrend May Have Topped
Stock-Markets / Stock Markets 2013 Aug 10, 2013 - 06:16 PM GMTBy: Tony_Caldaro

 The week started off with a gap down on Monday, rallied back to within one point of the uptrend high, and then did not recover for the rest of the week. Disappointing after last week suggested some more upside potential. For the week the SPX/DOW were -1.30%, the NDX/NAZ were -0.80%, and the DJ World index lost 0.4%. Economic reports for the week had a slight positive bias. On the uptick: ISM services, the WLEI, the monetary base, and the trade deficit improved. On the downtick: consumer credit, wholesale inventories and weekly jobless claims rose. Next week, a busy one, will include Industrial production, Retail sales, the CPI/PPI, reports on Housing and Options expiration. Best to your week.
LONG TERM: bull market
When the Intermediate wave v uptrend began in June at SPX 1560 we expected one of two scenarios to unfold. First, if it was short lived and topped in July it should hit the 1699 pivot. It did that. Second, if it extended into August it should hit the OEW 1779 pivot. It extended into August by reaching SPX 1710 on the 2nd. Currently, however, it does not look like it will make it to that next pivot. If this is correct, and the uptrend has topped, Major wave 3 has ended and Major wave 4, probably a 10% correction, is underway.
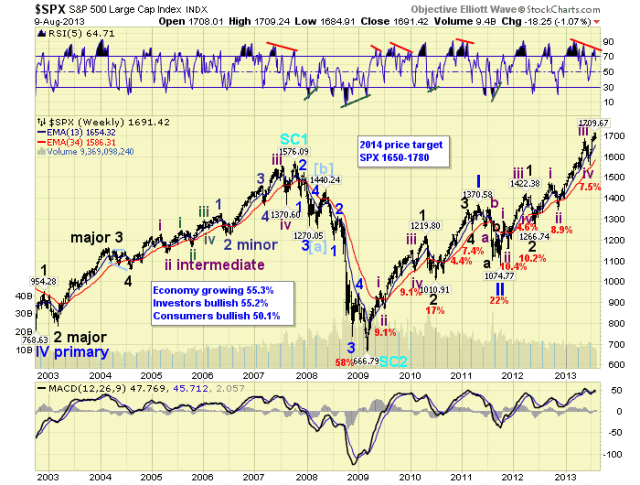
We have been counting this bull market as a five Primary wave event during a Cycle wave [1]. Primary waves I and II completed in 2011, and Primary III has been underway since then. Primary I divided into five Major waves/trends, with a subdividing Major wave 1. Primary III is also following the same pattern, but both Major waves 1 and 3 have subdivided into five Intermediate waves/trends. Major waves 1 and 2 completed by mid-2012, Major wave 3 has been underway since then. Intermediate waves i and ii of Major 3 completed by late-2012, and Int. waves iii and iv by mid-2013. Intermediate wave v of Major wave 3 began at that point in time.
If this uptrend has concluded we should next see about a 10% correction for Major wave 4. Then an uptrend to new highs for Major wave 5 completing Primary III. Then after a Primary IV correction, a Primary V uptrend should end the bull market. We are still expecting this all to unfold by late-winter to early-spring of 2014.
MEDIUM TERM: uptrend may have topped
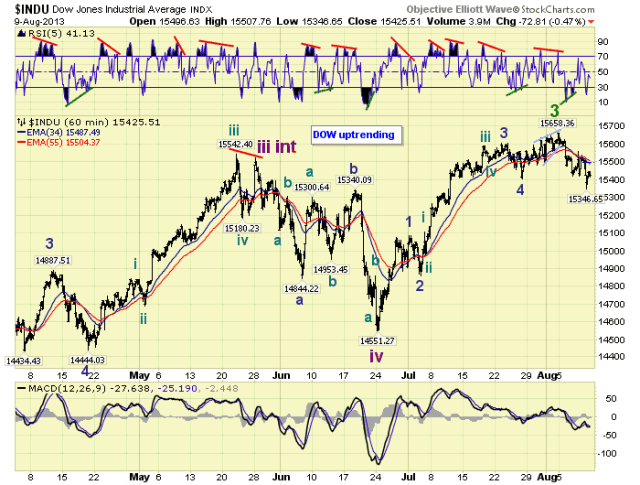
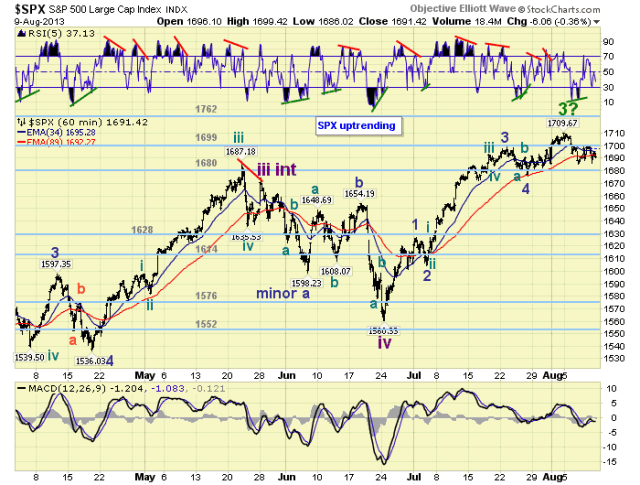
This Intermediate wave v uptrend began in mid-June at SPX 1560. We expected five Minor waves to unfold to complete the uptrend, which would also complete Major wave 3 of Primary III. Minor waves one through four were quite simple SPX: 1. 1627, 2. 1605, 3. 1699, and 4. 1676. Minor wave 5, however, has been quite complex. In the SPX it appears too choppy to count. In the DOW it looks like an ending diagonal triangle.
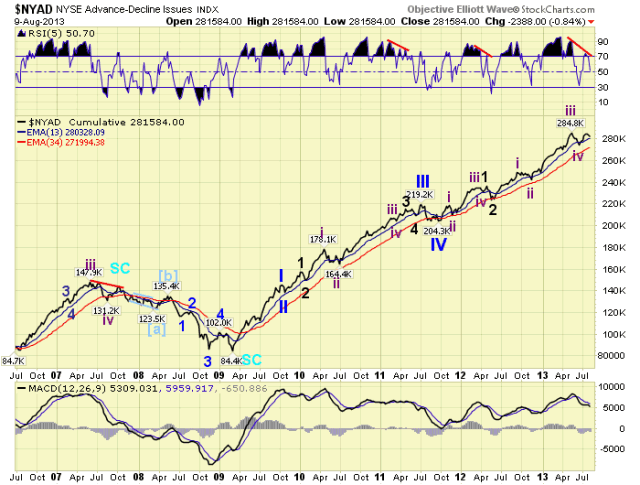
When the fifth wave of an uptrend is completing there are usually some negative technical signs suggesting a topping process is underway. We have them. The weekly chart posted earlier displays a double negative RSI divergence. The daily chart below, also displays a double RSI negative divergence and the MACD has turned down as well. Market breadth, as measured by the NYAD appears to have peaked on a negative divergence as well. The recent rise made a double top, and was weak like the previous Intermediate wave v’s.
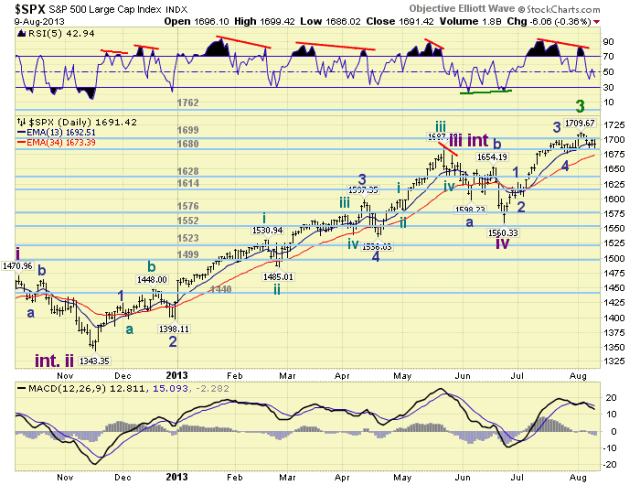
When the decline began early in the week we posted some comments. The first thing to look for would be if the SPX loses the 1699 pivot range. Then if SPX 1685 and 1676 are also exceeded to the downside a downtrend is probably underway. By Wednesday morning the SPX had lost the 1699 pivot range, and had declined 25 points: 1710-1685. The largest decline since the uptrend began. But it held support at SPX 1685 and rallied back to 1700.
We had also noted the last downtrend started when three of four consecutive trading days had gap down openings. By Wednesday the SPX had displayed the same pattern. The last point we made was about the DOW. Should the DOW break 15,405 its Minor wave 4 low a downtrend is likely underway. The DOW held above that low on Wednesday, rallied with the SPX, but made a lower low on Thursday, then broke that level on Friday. The DOW appears to be leading to the downside. Medium term support is at the 1680 and 1628 pivots, with resistance at the 1699 and 1762 pivots.
SHORT TERM
As noted above. Minor waves 1-2-3-4 were quite simple and Minor wave 5 has been choppy and quite complex. We had first thought it ended around SPX 1700 with an ending diagonal. Then it shot right up to SPX 1710. Now again it appears to have formed a larger ending diagonal triangle. Only this time while the SPX has held support, the DOW has completely retraced the entire Minor wave 5 advance. This suggests the uptrend is over, and the market should follow the DOW lower.
Short term support is at the 1680 pivot and SPX 1658-1667, with resistance at the 1699 pivot and SPX 1717. Short term momentum ended the week below neutral. The short term OEW charts are negative with the reversal level SPX 1695.
FOREIGN MARKETS
The Asian markets were mostly lower on the week for a net loss of 1.6%. India, Indonesia and Japan are in confirmed downtrends.
The European markets were mostly higher on the week for a net gain of 1.1%. All indices remain in uptrends.
The Commodity equity group were mixed on the week for a net gain of 0.5%. All three indices here are in uptrends. Worldwide 85% of the indices we track are in uptrends.
The DJ World index is uptrending but lost 0.4% on the week.
COMMODITIES
Bonds appear to be uptrending and gained 0.6% on the week.
Crude remains in an uptrend but lost 1.0% on the week.
Gold is uptrending and gained 0.1% on the week.
The USD is downtrending and lost 1.0% on the week.
NEXT WEEK
Monday: Budget deficit at 2:00. Tuesday: Retail sales, Export/Import prices and Business inventories. Wednesday: the PPI. Thursday: weekly Jobless claims, the CPI, the NY FED, Industrial production, the Philly FED and NAHB housing. Friday: Housing starts, Building permits, Consumer sentiment and Options expiration. Nothing on the FED’s agenda. Best to your weekend and week.
CHARTS: http://stockcharts.com/public/1269446/tenpp
http://caldaroew.spaces.live.com
After about 40 years of investing in the markets one learns that the markets are constantly changing, not only in price, but in what drives the markets. In the 1960s, the Nifty Fifty were the leaders of the stock market. In the 1970s, stock selection using Technical Analysis was important, as the market stayed with a trading range for the entire decade. In the 1980s, the market finally broke out of it doldrums, as the DOW broke through 1100 in 1982, and launched the greatest bull market on record.
Sharing is an important aspect of a life. Over 100 people have joined our group, from all walks of life, covering twenty three countries across the globe. It's been the most fun I have ever had in the market. Sharing uncommon knowledge, with investors. In hope of aiding them in finding their financial independence.
Copyright © 2013 Tony Caldaro - All Rights Reserved Disclaimer: The above is a matter of opinion provided for general information purposes only and is not intended as investment advice. Information and analysis above are derived from sources and utilising methods believed to be reliable, but we cannot accept responsibility for any losses you may incur as a result of this analysis. Individuals should consult with their personal financial advisors.
Tony Caldaro Archive |
© 2005-2022 http://www.MarketOracle.co.uk - The Market Oracle is a FREE Daily Financial Markets Analysis & Forecasting online publication.