


Is Stock Market SP500 1,600 the Next Support Level?
Stock-Markets / Stock Markets 2013 Sep 01, 2013 - 05:05 PM GMTBy: J_W_Jones

 Investors and traders alike are heading into the long weekend with a variety of potential risks facing them. The media has made us aware of the situation that is going on in Syria and that the United States may be planning a military strike.
Since the current Syrian situation arose, we have seen some strong volatility return to U.S. financial markets. The observed volatility has included both realized volatility and implied volatility in many of the various option chains. There are pundits who will surmise a variety of outcomes, but frankly no one knows for sure. Will oil prices spike if military action occurs in Syria? Will oil prices fall on a military action(s)? What will happen to gold? What will happen to risk assets? Will they find Jimmy Hoffa?
I have recently received several emails asking these questions. I have answered them all in the same manner. I have no idea what is going to happen in financial markets for sure. Anyone who says they do does not respect the randomness of markets. We can look at option based probabilities for some clues, but there is no definitive answer.
Instead I want to look at a very powerful tool that is available on most trading software platforms. Volume by price is a powerful tool to determine where key levels are in an index or price chart. The S&P 500 Index is shown below.
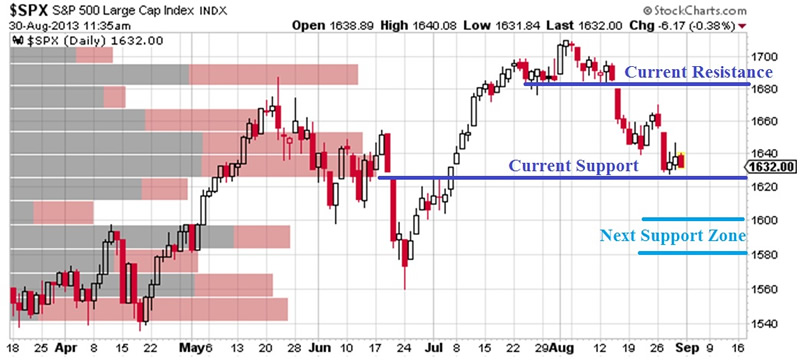
As can clearly be seen above, the obvious price points where we saw the most volume trade are highlighted. If price breaks below the current support level the 1,580 – 1,600 support zone is likely going to act as a magnet for price action.
Currently I think there is a high probability that we at least test the 1,600 price level in the next few weeks. The current probability that the 1,600 price level will be at least touched before the September SPX option expiration (expire in 20 days) is around 65% on Friday morning. The probability that the SPX touches 1,600 before the October SPX option expiration (48 days) is over 76%.
Clearly the implied volatility in the SPX option chain is telling us that odds are greater than 50% that prices work below the current support level over the next 3 – 7 weeks. Additionally we have strong volume by price data that indicates that the 1,580 – 1,600 price level will act as support.
I do not believe that making predictions is a great way to trade, but I think assumptions based on obvious support / resistance level as well as implied volatility based probability assumptions keep traders from making just pure guesses based on very little facts.
Back on August 16th I displayed the following chart in an article that was titled “Will 1,650 Offer Buying Support for the SP500?”.
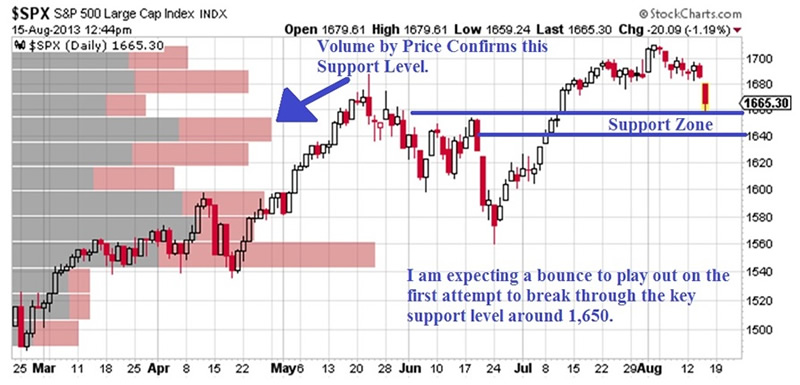
Unlike many market prognosticators, I will tell readers when I was wrong, when I was right, and when I was close. On August 16th I called for a bottom to play out around 1,650 and I was close. The bottom was actually formed intraday on August 21st. The forthcoming bounce rallied roughly 30 points before reversing back to the downside to our next support level around 1,630.
Ultimately we have the long weekend ahead and with Syria remaining in the forefront and the United States government fiscal debate looming down the road, markets could become quite volatile over the next 6 – 8 weeks. Traders need to act accordingly and manage risk through appropriate position sizing. Market conditions could get very interesting in the near future.
 Consider joining us for Stock and ETF Option trades. LABOR DAY SPECIAL SAVE 35% Coupon Code: “LaborDay35OFF” www.OptionsTradingSignals.com
Trade Stock & ETF Options Like a Pro – JOIN NOW
J.W. Jones is an independent options trader using multiple forms of analysis to guide his option trading strategies. Jones has an extensive background in portfolio analysis and analytics as well as risk analysis. J.W. strives to reach traders that are missing opportunities trading options and commits to writing content which is not only educational, but entertaining as well. Regular readers will develop the knowledge and skills to trade options competently over time. Jones focuses on writing spreads in situations where risk is clearly defined and high potential returns can be realized.
This article is intended solely for information purposes. The opinions are those of the author only. Please conduct further research and consult your financial advisor before making any investment/trading decision. No responsibility can be accepted for losses that may result as a consequence of trading on the basis of this analysis.
© 2005-2022 http://www.MarketOracle.co.uk - The Market Oracle is a FREE Daily Financial Markets Analysis & Forecasting online publication.