The Key Factor To Drive Gold and Silver Prices to Extreme Values
Commodities / Gold and Silver 2013 Oct 18, 2013 - 06:50 PM GMTBy: Steve_St_Angelo
 The precious metal investors are actually sitting on gold mine, and they don't even know the real reason why this is true. Many analysts are focusing on the huge amount of debt and fiat money in the system to be invested in gold and silver, but the fundamental root cause continues to go unnoticed.
While the massive amount of debt, derivatives and fiat money are indeed excellent reasons to own the precious metals, they are the mere symptoms and not the disease itself. The advanced societies of the world were built on an economic system that can only survive if it continues to grow. Without growth, the $100's of trillions in derivatives and debts would implode -- along with it the Suburban Retail-Commercial-Housing economy.
The key ingredient that drives the growth of the world's economies is energy. The most vital energy component of the global economy is oil. Peak oil would have come and gone, if it wasn't for the $trillions in new debt that allowed non-commercial oil resources such as shale oil to be extracted. Basically, the U.S. and world are purchasing a percentage of oil it cannot afford.
There is a great deal of energy disinformation published on the MSM and internet. Several of the well-known alternative media analysts on the internet have been beating the drum for shale oil & gas. Even though shale energy has been a boost to the U.S. economy, it will not be long-lived -- regardless of the hype and overly optimistic forecasts.
One of the most recent energy falsehoods being advertised, is that the U.S. is now the largest oil producer in the world surpassing Russia & Saudi Arabia. Stansberry & Associates published this recent chart showing the U.S. as the number one oil producer:
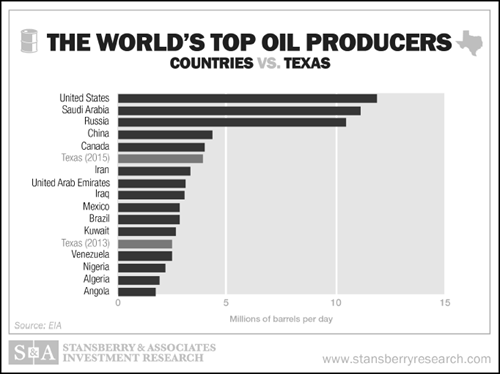
According to Stansberry & Associates, the United States is on top with approximately 12+ million barrels a day (mbd) of oil production, while Saudi Arabia comes in at 11+ mbd and Russia at over 10 mbd. These figures are from the EIA - U.S. Energy Information Agency, and do not equate as "OIL", but rather they represent the amount of total energy liquids.
Because the United States consumes so much oil, it is refining between 15-16 mbd of oil. Thus it records over 1 mbd of refining gains. Refining gains occur because you actually end up with a little more volume than you put in due to the refining and cracking process. Saudi Arabia and Russia export the majority of their oil so they don't have much in refining gains.
The chart below comes from the PeakOilBarrel.com which I highly recommend checking out as Ron Patterson does a great job presenting updated U.S. and world oil & gas data.
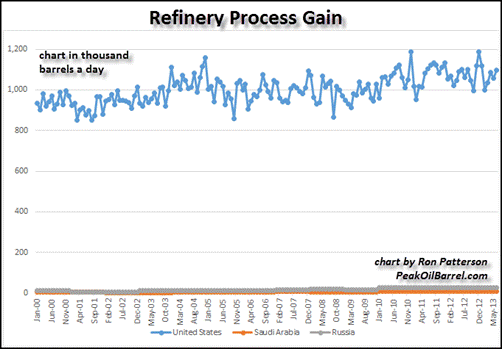
Here we can see that the U.S. enjoys a huge refining gain because it refines and consumes so much oil. Furthermore, that U.S. 12+ mbd Total Liquid figure also includes what is known as natural gas plant liquids and other liquids such as bio-fuels.
These energy liquids are not considered as oil by the industry. What is considered as oil, is called "crude & condensate." If we were to go by the industry standard for oil, this is an update on how the chart should look:
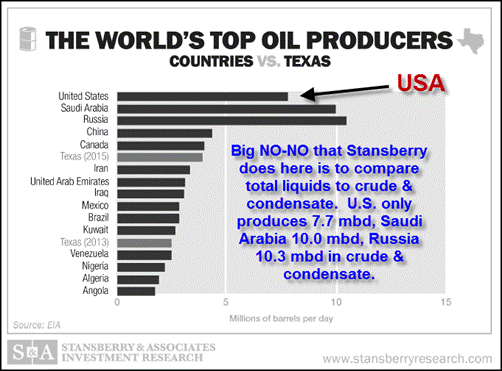
The reason why it is important to differentiate between the "oil" & "total liquids" is that crude oil is the higher dollar, higher energy content and more sought after liquid. Also, the U.S. is only producing approximately 7.7 mbd of actual crude & condensate while Saudi Arabia is pumping out 10 mbd and Russia 10.3 mbd.
So, for the United States to outperform these two countries, it needs to add 2.3-2.5 mbd of oil production. To present the chart as Top Oil Producers is disingenuous, if you are including less quality energy liquids that do not qualify as oil.
Understanding the energy situation is the KEY for the precious metal investors, even though they might not see it that way presently. As I mentioned earlier, shale oil and gas will not be an energy resource or savior to count on for the long-term. Annual decline rates are so high, the only way to increase shale oil production is by massively increasing the amount of new wells.
The U.S. is able to accomplish this feat of increasing shale oil & gas production because it has the largest amount of drilling rigs in the world. Matter-a-fact, the U.S. has more than half of all the drilling rigs in the world:
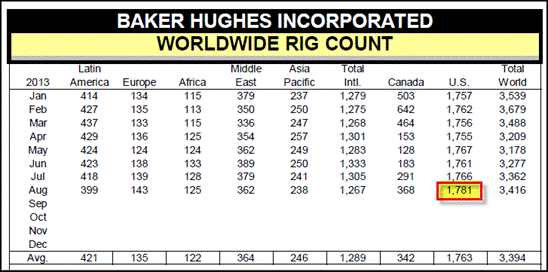
If we take a closer inspection of the table above, you will notice that the U.S. actually has 500 more drilling rigs than all the other countries on the planet if we exclude Canada. This is just an amazing amount of drilling infrastructure the majority of the world does not contain.
For the rest of the world to be able to duplicate what the United States has done in shale energy production (which it can't), it would have to seriously increase its drilling rig capacity.
Genius Investing: Seeing the Trend Before Everyone Else
The secret to successful investing is spotting the trend before everyone else. Those who saw the 4-part History Channel series, "The Men That Built America." understand this principle.
The docudrama starts out with the first man highlighted in the series named, Cornelius Vanderbilt. Vanderbilt also known as "The Commodore", made his original fortune in the ship & steamboat business in the mid 1800's. However, the Commodore noticed early on, that the railroads were starting to increase its presence in the transportation and shipping industry.
Vanderbilt decided to sell his nautical assets to buy up railroads instead. The Commodore and later his son, William went on to control much of the railroad business in the United States.
Again, the key to success is to be able to spot the next great investment trend before others realize it. The majority of investors in the world today have their wealth tied-up in assets that will become increasingly worthless in a peak energy environment. These assets will disintegrate in value due to a falling energy supply.
Some of the top gold analysts such as Jim Sinclair believe if the dollar was backed by gold then it would restore confidence and faith in the monetary system. Even though this sounds like a good plan on the surface, it does nothing to change the impact of a falling energy supply on the world's economies including its $trillions in paper assets.
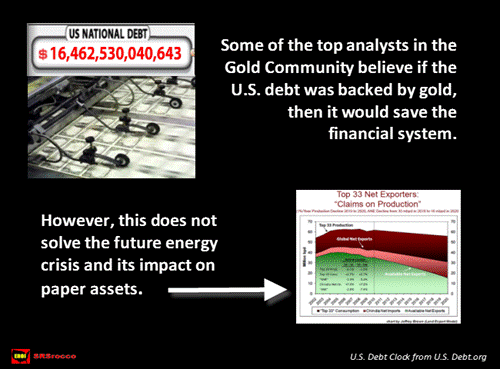
The small chart on the bottom right is forecasting the decline in Available Net Oil Exports (ANE) created by Jeffery Brown. ANE is nothing more than the oil exports available to the remaining 155 oil importing countries minus the top 33 oil producers domestic consumption as well as China & India.
Available net oil exports peaked in 2005 at 40.6 mbd and declined to only 34.4 mbd in 2012. This means the oil importing nations now have 6 mbd less of oil to import than they did just eight years ago.
Interestingly, the price of oil has risen more than three-fold since this time period -- amazing how increased competition on top of falling supply can push the price of a commodity much higher. So, here we can see that there are additional energy factors to consider besides overall global oil production in the total energy environment.
Why? Because Available Net Oil Exports have declined even though overall global oil production has increased since 2005. Of course, you won't find this sort of analysis coming from Stansberry & Associates or even the folks at Casey Research.
Don't get me wrong, the majority of analysis coming from these organizations is excellent, however I believe their energy information and data is faulty. This is a critical assessment as energy is the vital foundation of the economic markets. Thus, their energy analysis will mislead many investors into a much different future than what I perceive from the data I am seeing.
This is where investors need to educate themselves so they can see the INVESTMENT TREND before everyone else. Presently, precious metal sentiment is in the toilet. This is due to the manipulation and machinations of the Fed & Central Banks. Fortunately for the frustrated gold and silver investors, the monetary authorities cannot squeeze physical gold, silver or oil out of a Federal Reserve Note.
Gold and silver will become some of the best investments in the future as they are a store of "Economic Energy", a term coined by Mike Maloney. On the other hand, most paper assets are not a store of this economic energy, but rather what I call, "Energy IOU's." Energy has to be burned to create the economic activity to satisfy and pay back these paper assets.
The world is holding onto trillions of dollars of Energy IOU's masquerading as assets that will have no future... and the future is now here.
The U.S. economy and world are heading toward an ENERGY WALL and the majority of the public and investors are not prepared for the ramifications. Certain investments will hold their value or show significant gains, while the majority will decline.
Gold and silver will be driven up to extreme levels in the future as investors switch out of increasingly worthless paper assets and into the precious metals to protect their wealth before it evaporates.
Have you made the correct investment decisions?
The SRSrocco Report will be putting out public and paid reports in the future that will explore, analyze and discuss how energy will impact the precious metals, mining and overall economy.
© 2013 Copyright Steve St .Angelo - All Rights Reserved Disclaimer: The above is a matter of opinion provided for general information purposes only and is not intended as investment advice. Information and analysis above are derived from sources and utilising methods believed to be reliable, but we cannot accept responsibility for any losses you may incur as a result of this analysis. Individuals should consult with their personal financial advisors.
© 2005-2022 http://www.MarketOracle.co.uk - The Market Oracle is a FREE Daily Financial Markets Analysis & Forecasting online publication.


