


Santa Delays Stock Market Correction
Stock-Markets / Stock Markets 2013 Dec 30, 2013 - 02:28 PM GMTBy: Andre_Gratian

 Current Position of the Market
SPX: Very Long-term trend - The very-long-term cycles are in their down phases, and if they make their lows when expected (after this bull market is over), there will be another steep decline into late 2014. However, the severe correction of 2007-2009 may have curtailed the full downward pressure potential of the 40-yr and 120-yr cycles.
Intermediate trend - An important top formation is in the making.
Analysis of the short-term trend is done on a daily basis with the help of hourly charts. It is an important adjunct to the analysis of daily and weekly charts which discusses the course of longer market trends.
SANTA DELAYS CORRECTION
Market Overview
2013 has been a very bullish year! But don't expect 2014 to follow in its steps. The bulls' moment in the sun will come to an end as we move into the New Year. Cycles, structure, and animal spirits are all conspiring to cause their demise sooner rather than later. Keep reading this weekly newsletter! One of my New Year's resolution is to alert you when this time has arrived.
It does not come as a surprise that the anticipated correction was delayed. I had mentioned that we were entering the most bullish period of the year and that the pattern we had made could simply be a correction and not the beginning of a larger decline. Nor was it much of a surprise that SPX went past the inflection point determined by the conditions suggested last week. Since the bulls are still in charge, the odds are that SPX will now move to its next (and more challenging) projection target taken across the 1359 base instead of the 1338 level. That means that there could still be another 20 points in this rally before we get to the level from which we can start a decline into the mid-February cycle lows.
The Santa rally tagged on to the one started by the Fed when it disclosed the details of its tapering strategy. This created an uninterrupted 75-point move which, only this past Friday, showed signs of slowing down. This interruption has enabled the hourly oscillators to roll over and start correcting. Since they are still in a corrective mode, there is good possibility that the - so far very limited - correction will extend into Monday. A pull-back down to about 1835 would be normal, but anything beyond could mean that something more severe has started.
Since the bullish period at this time of the year extends into the first few days of January, it is likely that the correction which is expected to last into mid-February will not start for another week or so. This means that after a minor pull-back, we could extend the move up to the level of the more bullish count. As usual, we'll let the market let us know what it wants to do.
Chart Analysis
As I did last week on this daily SPX chart (courtesy of Qcharts), I am showing the price channels of various time phases, starting with the bull market channel from March 2009 (blue) up to the short-term channel starting in early October (green).
The index has been trading above the top of the bull market channel for the better part of the past 7 weeks. This is the sign of a very strong, but also very overbought market. With this last burst of strength, it is trying to get above the long-term channel from October 2011. Last week, it succeeded in getting above (if only by a small margin) but the fact that it encountered some selling on Friday could mean that this channel line top is providing the anticipated resistance. Resistance also comes from a couple of parallels: one to the intermediate channel, and one to the short-term channel. Perhaps this will be enough to stop the advance, at least temporarily.
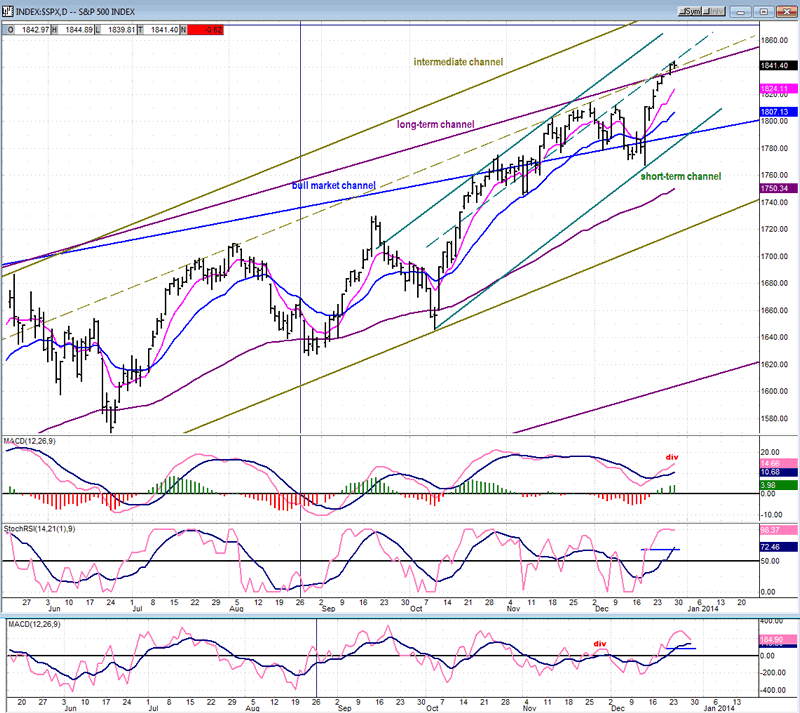
Any beginning student of technical analysis knows that the top of a price channel is a logical place for a price trend to meet with resistance. But logic is not good enough in market forecasting. It has to be confirmed by tangible supporting evidence. In this case, we find it in the daily oscillators at the bottom of the chart. Only one of the three is still rising: the MACD! But it is also the one which gives us the clearest evidence that the market is approaching a top because it is displaying negative divergence. The other two are more reflective of the short-term trend and beginning to turn. Should they continue downward and drop below the blue horizontal bar, the yellow flag will turn red -- whether or not they first display negative divergence.
Considering what was just pointed out, we can deduce that the SPX is nearing a top but is not quite there yet. We need more concrete signs of developing weakness. Perhaps we will have them in the next few days.
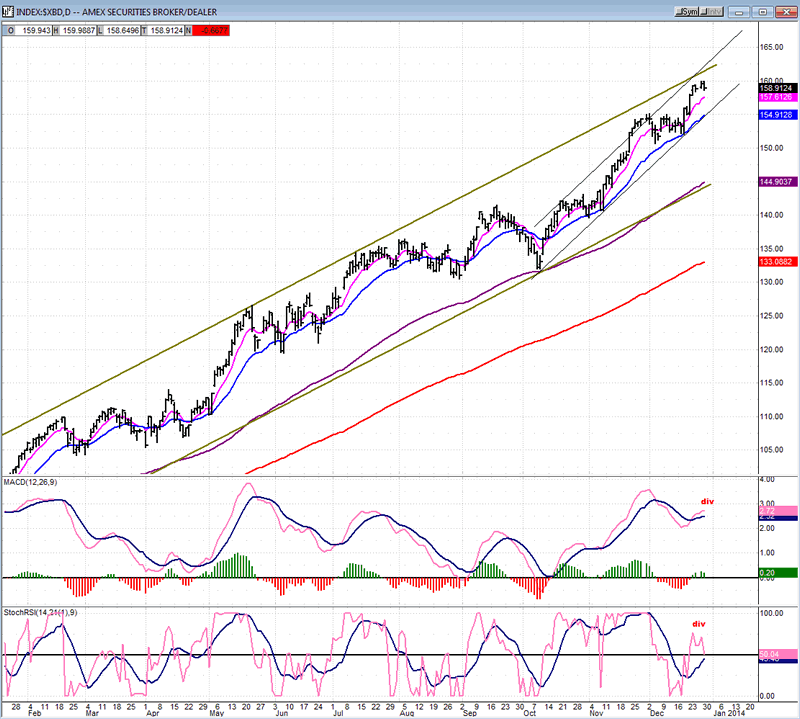
One of the better leading indexes is the XBD (Amex Securities Broker/dealer) whose daily chart is shown below (also courtesy of QCharts). It took it several months after the 2009 low to get going, but since November 2012, it has been in a steady uptrend which has matched if not exceeded the SPX in its consistent strength. As of Friday, it too is showing some signs of nearing a top and, if one were to get really picky, one could say that its oscillators are even a little more advanced -- especially the SRSI which, in concert with the MACD, is showing some well-defined negative divergence.
Its short-term trend started in October also, and here is where it has a distinct advantage over the SPX because its structure is much clearer. It is obviously completing a 5-wave pattern, most likely having finished wave 3 of 5 and having started wave 4 of five. That meshes perfectly with the suggestion that I made above: that we had probably started a minor correction which should continue on Monday, last a couple more days, and be followed by wave 5 of 5, completing the move from October, and starting a decline into mid-February.
I am not going to show the SPX hourly because it got messed up over the week-end and developed a gap of several days, distorting it and making it almost impossible to analyze correctly. The two charts above give us enough clarity to know what to expect over the next week or so.
Cycles
The next important cycle to affect the market could top over the next few days and probably make its low in mid-February.
Breadth
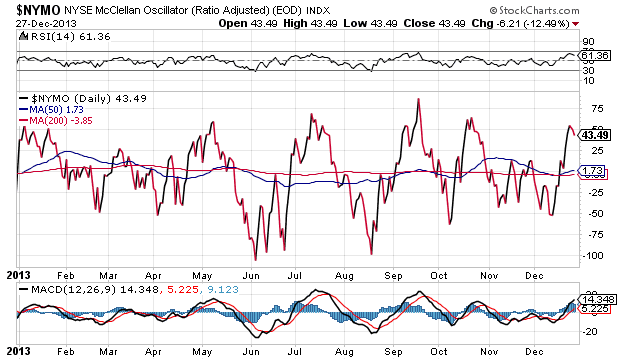
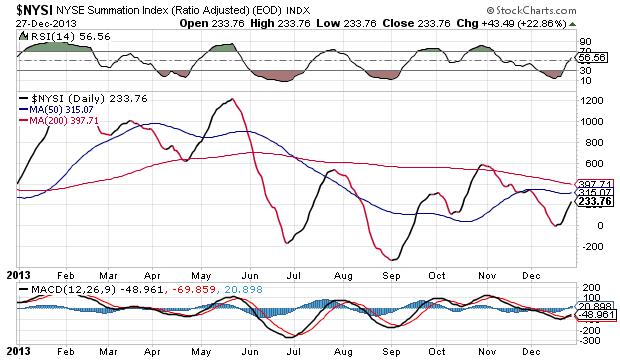
The McClellan Oscillator and Summation Index (courtesy of StockCharts.com) appear below.
The McClellan Oscillator has started to turn down after taking advantage of the Xmas period exuberance to finally rise above the mid-point of its range where it had been stuck for about six weeks. Even so, its rally is not representative of the SPX's 75-point romp, and reflects inadequate breadth support for that kind of move.
If you have trouble seeing that in the NYMO, you will have no problem seeing it in the Summation Index which has moved up, but is nowhere near its November top and miles away from the May high. Although you would have been in trouble if you had acted on the NYSI pronounced divergence when it first started to show, the prolonged weakness of this indicator, with hardly any relief, has to be telling us something about the market. At some point in the not too distant future it will heed the warning of the NYSI and, when it does, could make up for lost time.
Sentiment Indicators
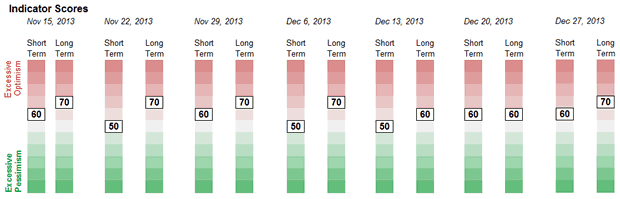
In transferring data to my new computer, three weeks of long-term Friday readings from the SentimenTrader (courtesy of same) were lost. (Editors's Note: I have included the past few week's readings.) If you recall, these had dropped back down a notch to 60 during the two-week market correction, but the elevated warning of 70 has returned and it is just another sign that the SPX is again reaching dangerous levels.
VIX
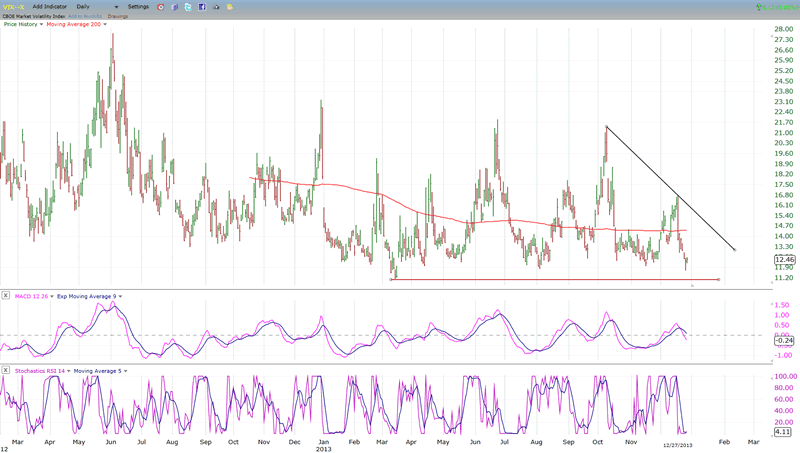
VIX's attempt at establishing an uptrend failed on the day of the Fed's announcement about its plans for tapering. Since then, it has continued to drop and has made an 8-month low. Thursday and Friday saw it start a rally while the MACD remained above its November low. This is the beginning of positive divergence which corresponds with an oversold SRSI and suggests that VIX is thinking about starting another rally which would correspond to a correction in the SPX.
IWM (ETF for Russell 2000)
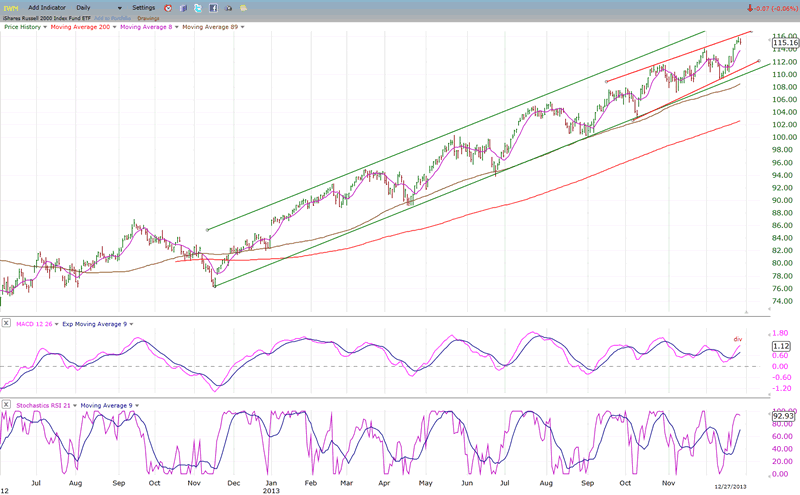
IWM's uptrend from November 2012 matches that of the XBD, right up the top of Friday's move where it also shows an inclination to make a short-term top. IWM is another reliable leading indicator for the market. A couple of weeks ago, it started to develop relative weakness from SPX along with QQQ and XLF which I then interpreted as the possibility that a more important top was forming. But it was a false alarm and since then, they all have joined the SPX in making new bull market highs.
Nevertheless, the IWM MACD has joined that of SPX and XBD in showing some meaningful negative divergence, except even more so than the other two indices. Here again, it's still only a hint that a top may be forming and we'll have to wait for more reliable signs that the market is getting ready to correct.
BONDS
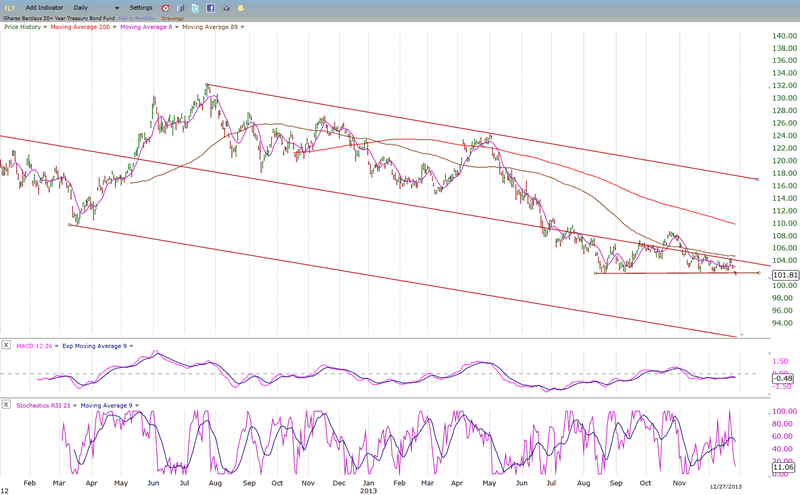
A week ago, it looked as if TLT was beginning to form a base as a double bottom which could start a rally. However, after last week's action, the bulls should exercise some caution, especially considering the sharp drop in its MACD which does not bode well for the direction of prices over the near term. If there is more of a drop in the index, it could now be on its way to the bottom of its long-term channel.
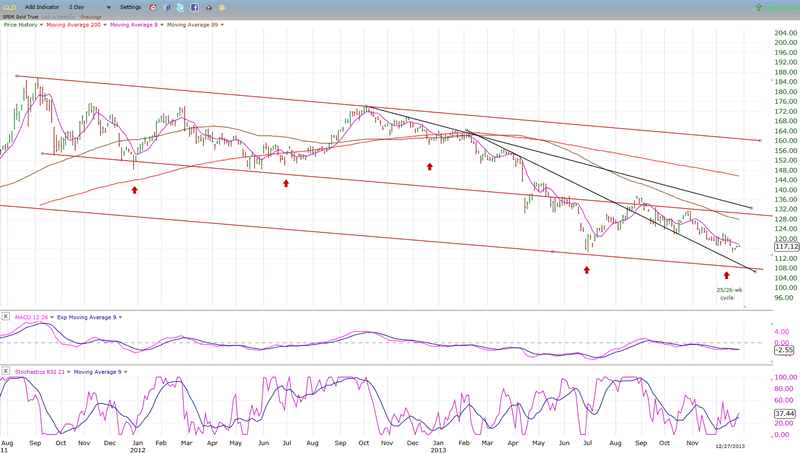
GLD (ETF for gold)
GLD is most likely creating a double-bottom at the level of its former 25/26-wk cycle low. All the red arrows indicate where the bottom of that cycle has occurred and, as you can see, with the exception of only one which created a sideways consolidation of several weeks, all gave birth to an uptrend of sorts.
It is not possible to know what kind of rally the current one (which should have already arrived at its low point) will produce, but it's a good bet that something tangible will develop. The oscillators are in a good position to oblige.
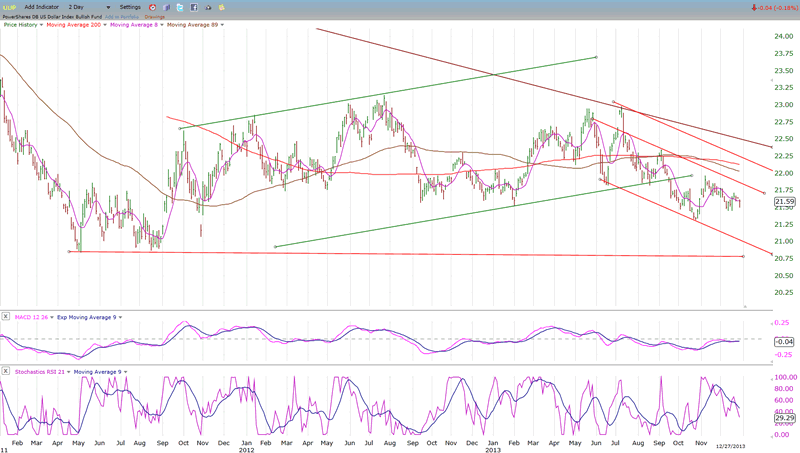
UUP (dollar ETF)
UUP's price has been suppressed by the Fed's decision to keep interest rates at a very low level. This has caused it to trade for the past two and a half years in a broad range which, if it becomes a base, could eventually trigger a substantial uptrend. For the time being, it is engaged in a short-term decline which could continue for a little while longer -- perhaps until the tapering process is farther along and interest rates begin to rise decisively.
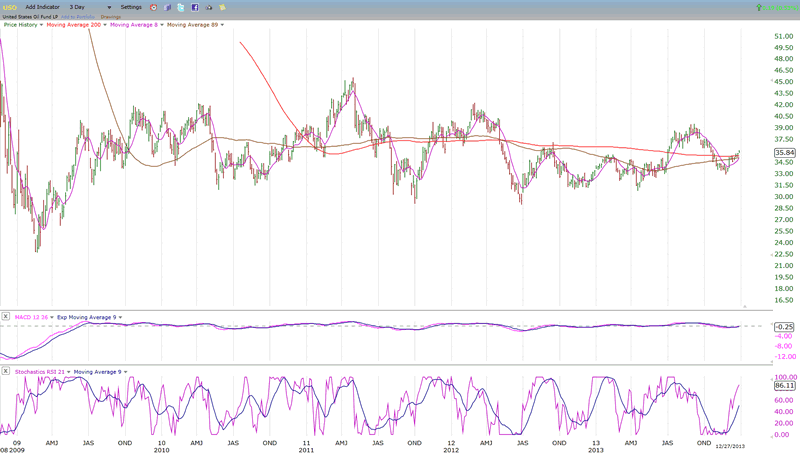
USO (United States Oil Fund)
USO has been trading sideways also, but for a much longer time: since the beginning of the bull market! If it could not make any headway in a bull run, what will it do when the latter runs out of steam and gives way to a bear market? Although USO could still engage in some short-term gyrations, its long-term prospects look rather dim.
Summary
With a severely overbought market approaching a time frame when it will be adversely affected by long-term cycles which are bottoming, it is logical to expect that the end of the bull run is nearly over. However, since the market has already defied gravity time and time again, we need to see more concrete signs that it is ready for an important reversal.
The next few weeks are very likely to produce those signs and we must keep alert and watch for them objectively.
P.S. Best wishes for the New Year and may they include all the good, positive thoughts and actions that made the last one memorable!
FREE TRIAL SUBSCRIPTON
If precision in market timing for all time framesis something that you find important, you should
Consider taking a trial subscription to my service. It is free, and you will have four weeks to evaluate its worth. It embodies many years of research with the eventual goal of understanding as perfectly as possible how the market functions. I believe that I have achieved this goal.
For a FREE 4-week trial, Send an email to: ajg@cybertrails.com
For further subscription options, payment plans, and for important general information, I encourage
you to visit my website at www.marketurningpoints.com. It contains summaries of my background, my
investment and trading strategies, and my unique method of intra-day communication with
subscribers. I have also started an archive of former newsletters so that you can not only evaluate past performance, but also be aware of the increasing accuracy of forecasts.
Disclaimer - The above comments about the financial markets are based purely on what I consider to be sound technical analysis principles uncompromised by fundamental considerations. They represent my own opinion and are not meant to be construed as trading or investment advice, but are offered as an analytical point of view which might be of interest to those who follow stock market cycles and technical analysis.
Andre Gratian Archive |
© 2005-2022 http://www.MarketOracle.co.uk - The Market Oracle is a FREE Daily Financial Markets Analysis & Forecasting online publication.