


Gold Price is Going Higher
Commodities / Gold and Silver 2014 Jan 12, 2014 - 06:21 AM GMTBy: Thomas_Clayton

 Two weeks ago I wrote: “Gold Probably Has Bottomed”, Last Week Gold Has Bottomed”, and this week, “Gold Is Going Higher”. Of course, there must be proof and the proof is in the Charts. Anyone who can predict for more than a few days, I don´t think they know what they are talking about. There is this Harry Dent Service you can subscribe to who says “Gold will go Up then down to $250 an ounce.” He lost my following with that statement forever. Prices do undulate, however, in waves in a Mathematical Rhythm which according to the Elliott Wave Theory. Sometimes the Five Wave Theory works and sometimes it doesn’t then the interpreter covers himself by subwaves, and if this happens and that happens. Well, the Theory seems to work if July 28th,2013 was indeed the bottom and retested in late Decemember 2013 with a confirmation on the last day of the year, December 31, 2013.
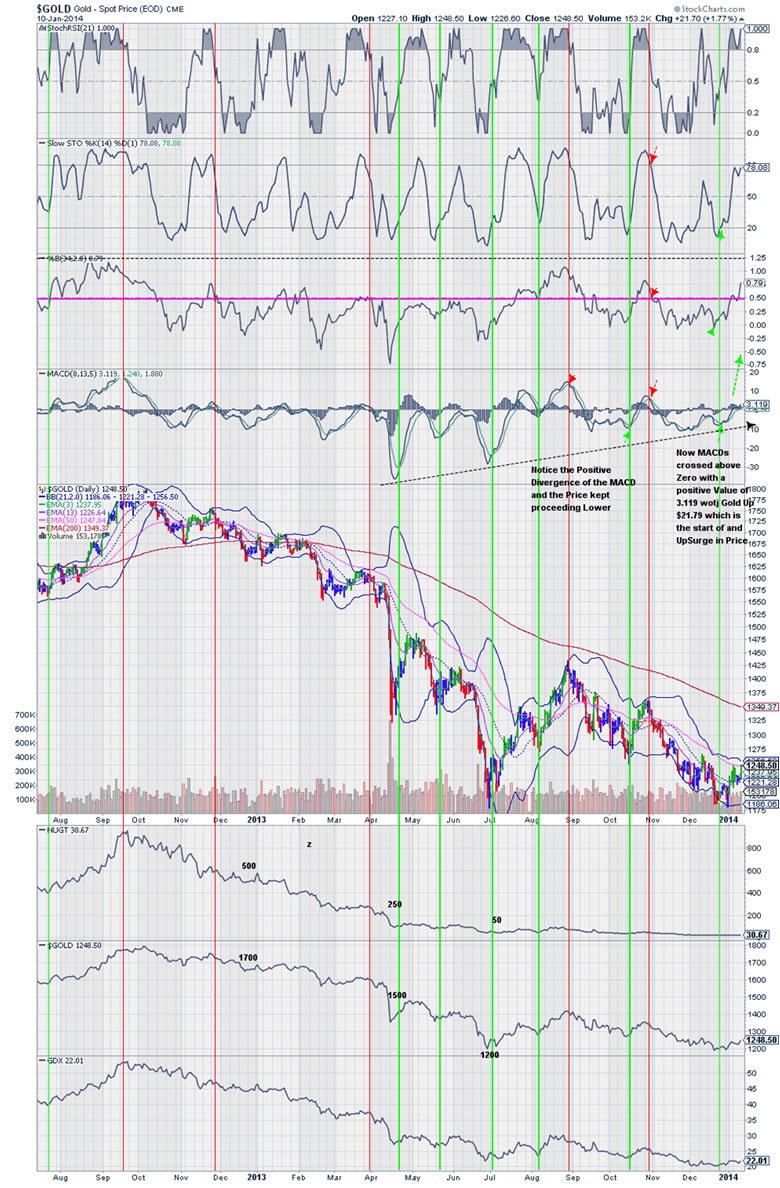
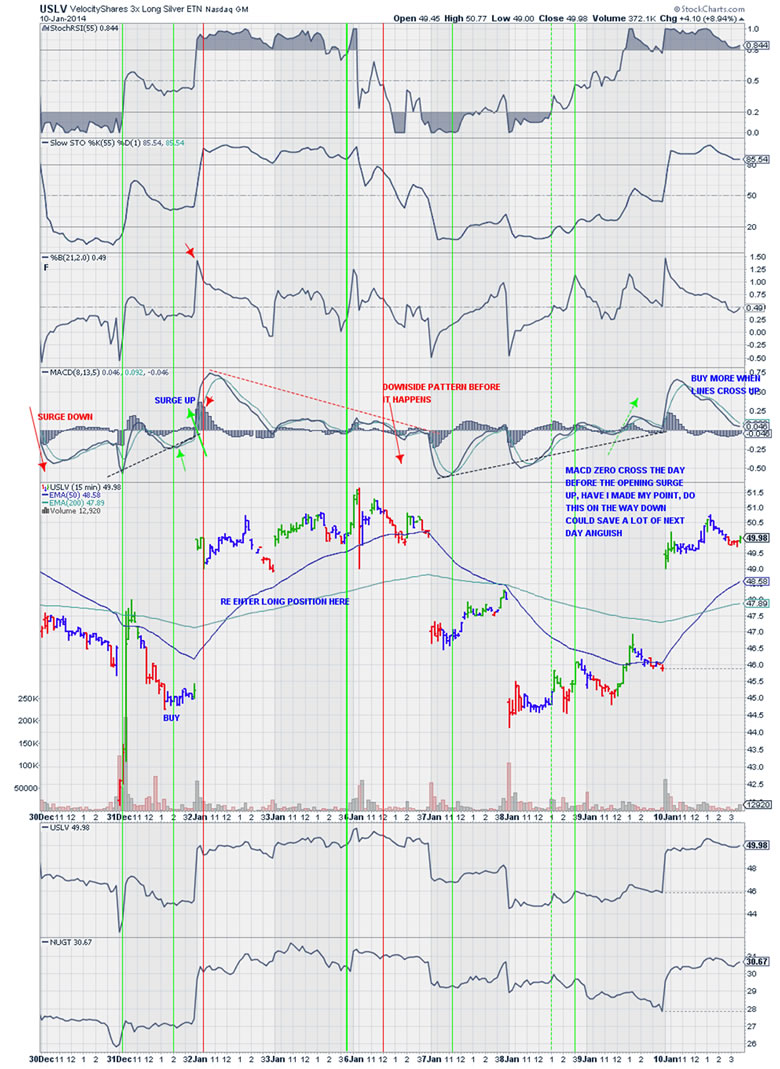
When I first started doing this thirteen months ago, I could not get the MACD to coincide with the peaks and bottoms with the defaulted parameters given. So I set the MACD aside and worked with the Stoch RSI, Slow Stoch, %B, and got them to synchronize by manipulating the parameters with Fibonacci numbers which seemed to work ok. It was not perfect. Then I went back to the MACD which mean Moving Average Convergence Divergence which are variable moving averages set by the Technical Analyst. MACD seems to measure on a graph the Area between the Fast and the Slow Moving Averages which reflects the Maximum and Minimum Are in between the lines as we learned in High School Algebra II. So I went back to the MACD and set the parameters to Fibonacci numbers 8,13,5 and 13,21,8 etc and depending on the Time Frames from one mnute to weekly, I finally got all the Indicators to synchronize precisely and accurately. Then by sitting back from my screen about 1 meter away, I could see certain correlations and configurations which seemed to repeat themselves and were Consistently accurate. Here the MACD which I almost discarded, has become the Dominant, Number One Indicator which I watch. I found even though the Stoch RSI, Slow Stoch gave a Buy Signal with respective up crosses at 0.2 and 20, why was the Price still moving Down? This Lost Lots of $$ for some of my Followers, which I feel very bad about. Then I could see the MACD lines moving Up but why was the Price dropping. The Key was, the MACD lines had to move Above Zero on the MACD Indicator for the Price to start an Uptrend and this usually coincided with what I call the Surge Up and conversely the Surge Down. Bear with me, and you will see with the charts I have selected as Examples. And these will be Charts which prove that Gold is starting an Uptrend with the MACD lines breaking above Zero on the Shorter Time frames from 1min to 60min, and the Daily MACD is approaching Zero which, with follow through Buying, will cross above Zero and start a longer term Uptrend.
This is really the only way you can measure this phenomenon is with Indicators and with the Correct Interpetation. I can sit here all day and put out Charts, but without the Precise Interpetation, they are Worthless and can give the observer the exact wrong direction to take.
Back in the late 1960s and early 70s, I worked for Dean Witter as an Asst V.P. in Commodity Trading. We had very rudimentary computers and no software to support the above discussion. If you wanted a Chart, we did it manually after the close. John Murphy has produced everything which was lacking to make an Intelligent Technical Analysis of Price Movement whether it be stocks, commodities, interest rates, bonds etc. I congratulate, John Murphy and stockcharts.com for providing us with what I call the WEAPONS OF MASSIVE WEALTH.
So see for yourself. I welcome feedback for this gives me many times a problem to solve and to enhance the results of my technical analysis. See for yourself and I welcome feedback at stemsmexico@gmail.com. From here South of the Border, I cannot visualize living in the U.S. ever again with Federal Reserve and the Dummies in Congress and Puppet Presidents. Maybe not Dummies, but do and vote how they are told to stay in office, line their bank accounts with wealth and not go the way of Pres. Abraham Lincoln and JFK and Bobby. Also, 80% of the food in the U.S. is tainted with Glyphosphate due to the Roundup Ready Monsanto seeds. You are eating Toxic Food. Please your opinion and feedback. I have more Info. Your great grandkids may be sterilized. Billy Gates is one of Them, New World Order Bilderbergs, One Percenter Elites. Cause for Alarm. Wealth is not worth this i.e. when your name is Rothschild and have to hide within your castle not able to walk in public. Oh Well, whatever works, More Power (pun) To You.
GOLD IS GOING HIGHER and if isn’t, see below if Gold & Silver are trending Down. Doesn’t matter, Who cares? AS LONG AS WE MAKE MONEY..RIGHT? NUGT, DUST, USLV and DSLV..just Follow my Charts and go with the Trend. THESE CHART ARE LEVERAGED TIMES 3. DO NOT BE WRONG! These are teaching charts to show you How. Many Followers tell me, “This is the first time I have made money in the Market” or “I am making tons of $Money.” THIS MAKES ME FEEL REAL GOOD. “Share and it will return packed down and overflowing.” So my Pastor used to tell me. I am Sharing now waiting for the Return Overflowing bit.
My primary concern is that You make lots of Money. Good Luck and God Bless
$GOLD WEEKLY CHART Pg 15. SIX YEARS stockcharts.com, PublicChartList, EasyMoney Clayton Tom,stemsmexico@gmail.com
Daily Chart from Sept 2012, Historical High, to Now, Intermediate Bottom
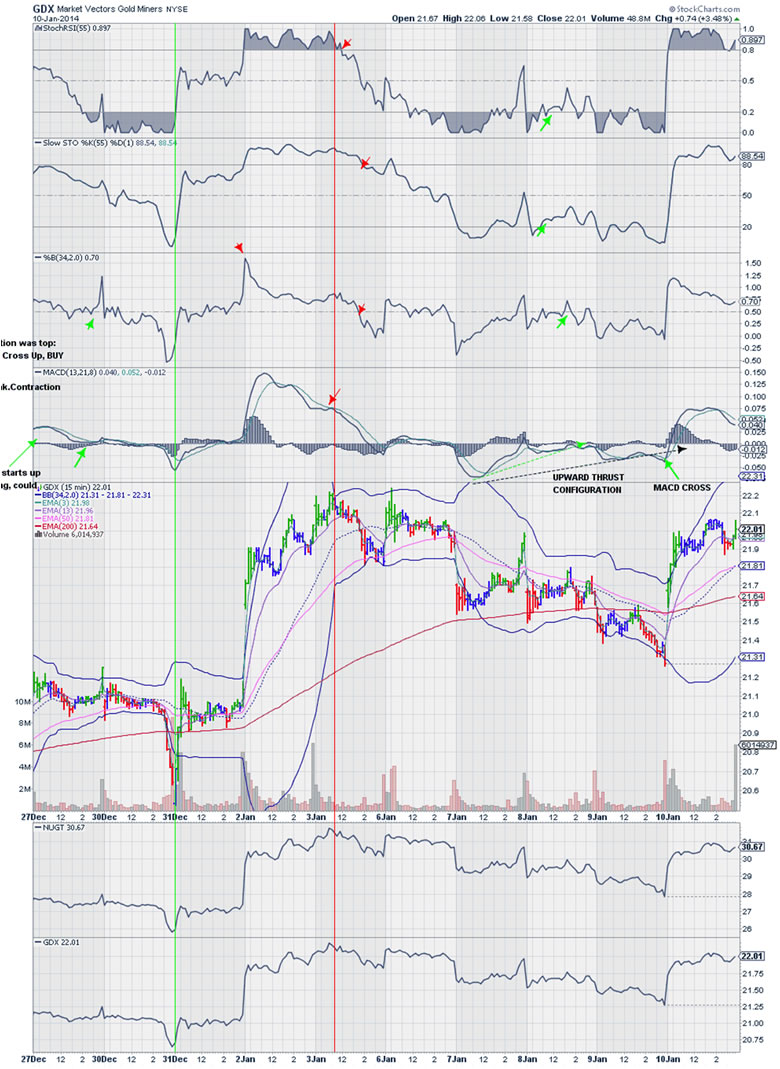
GDX 15 min Pg 21 at stockcharts.com, PublicChartLists, Easy$$ Clayton Tom stemsmexico@gmail.com
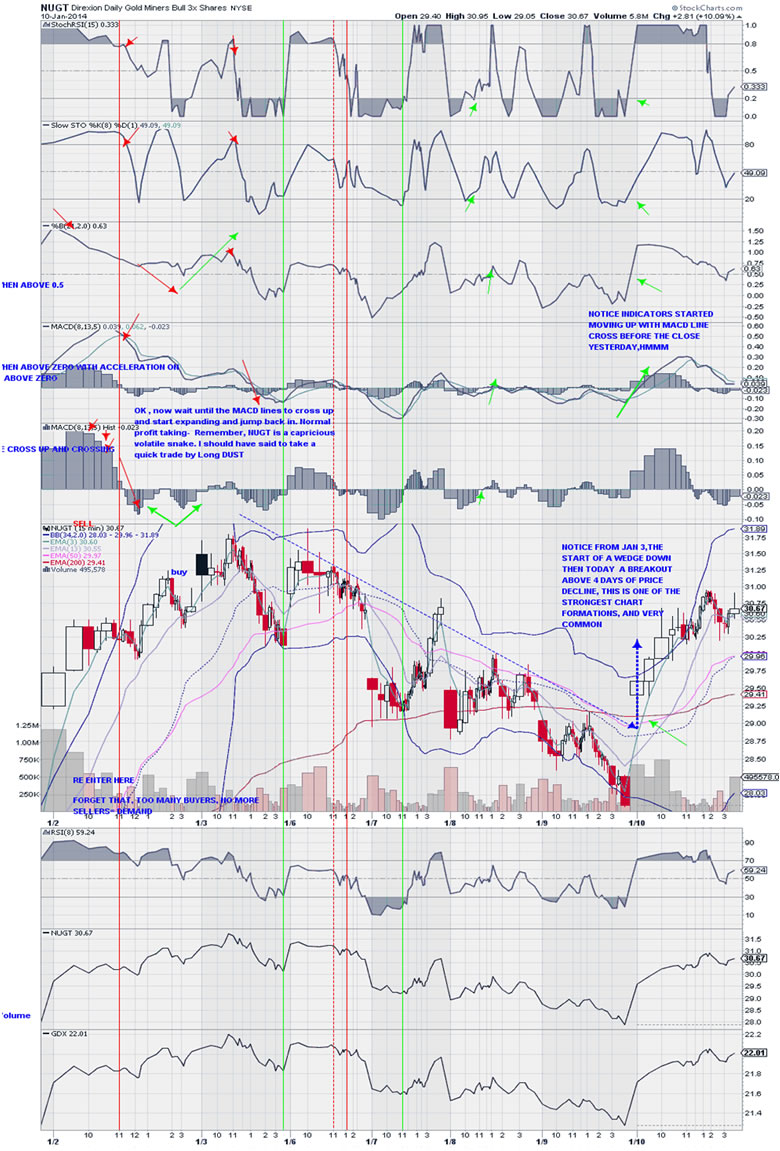
NUGT 15min IS THE 3X FUNCTION OF GDX gold miners Volume Candle format Buy signal was before the close of the Trading Session the Day Before..PRECISE see Green Arrows. Front Runners. Join The Manipulaters give you a chance

DUST IS THE ANTITHESIS OF NUGT.. if GOLD is trending Down, best to be Long Dust..15min Chart An Alert Trader will make very Profitiable Trades just using these Charts, Pg 17, stockcharts.com PublicChartList, Easy Money Clayton Tom
AS GOLD GOES, SILVER GOES. USLV X 3 15min There is a lot here. Study This Chart Pg 18, stockcharts.com, Public Chart List, Easy $$, Clayton Tom
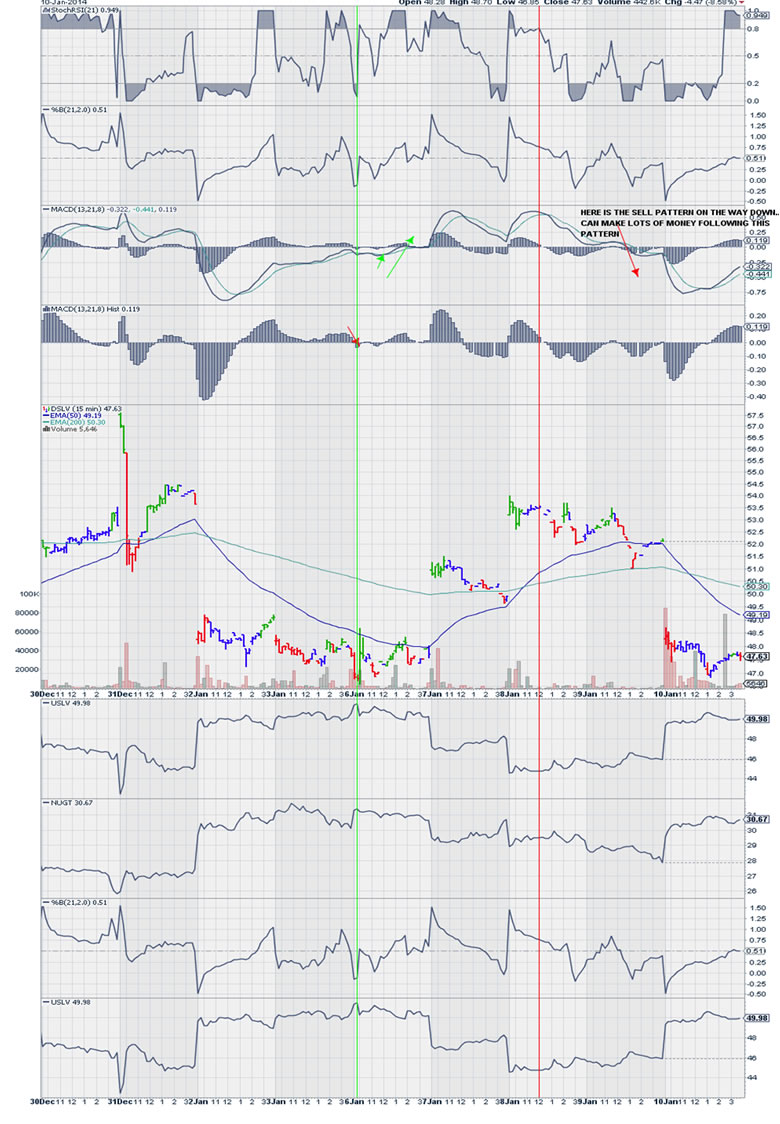
Ok What if Silver is Trending Down: DSLV 15m Pg 18 stockcharts.com, Public Chart List, Easy $$, ClaytonTom
About the Author, Using my system at stockcharts.com, Public Chart Lists, Easy $$, by Clayton Tom, you will see the rest of my work in reference to Gold, Silver, NUGT, DUST, USLV, DSLV, etc SPX, $VIX, VXX, UVXY, etc UPRO, SPXU, ERX, ERY, DIG, DUG, FAS, FAZ, TNA, TZA, DRN, DRV and Winners of 2013, i.e. Pg 6, AAPL, GOOG, AMZN, PCLN, NFLX, FB, HLF (Hello, Mr Ackman) etc. You may ask me to do an Opinion based strictly on the Indicators I use. stemsmexico@gmail.com. I am an ex-broker, Asst. V.P. in Commodities with Dean Witter back in the late 1960s and early 70s and went through the exact training course as depicted in the movie, “Seeking Happyness” with Will Smith. I am also a retired Pharmacist via Cal Berkeley, U.C. School of Pharmaceutical Science and the mandatory Courses in Math has enabled me to understand the Derivation of the Indicators used to make this almost a perfect Technical means of precisely spotting Tops and Bottoms as a function of the Price Fluctuations of Stocks, ETFs, Currencies, Commodities and Financials Bond Instruments. I also lack just one semester for my MBA in Marketing at Univ. of Cal . SF State University. Retired after 25 years in Retail Pharmacy, rated as the most Competive Independent Pharmacy Chain in the Nation by the trade journal Pharmacy Times, 1995. Was the first Pharmacy in the U.S. to promote Generic Drugs in the early 1970s.
By Thomas Clayton
© 2013 Copyright Thomas Clayton - All Rights Reserved
Disclaimer: The above is a matter of opinion provided for general information purposes only and is not intended as investment advice. Information and analysis above are derived from sources and utilising methods believed to be reliable, but we cannot accept responsibility for any losses you may incur as a result of this analysis. Individuals should consult with their personal financial advisors.
© 2005-2022 http://www.MarketOracle.co.uk - The Market Oracle is a FREE Daily Financial Markets Analysis & Forecasting online publication.