Stock Market Trading Amid Travesty- Facts are Stubborn Things Part III
Stock-Markets / Elliott Wave Theory Apr 19, 2008 - 05:16 PM GMTBy: Joseph_Russo
 Addressing the Cause and Effect of the Credit Crisis- Facts are Stubborn Things Part I
Central Banks' in Tatters- Facts are Stubborn Things Part II
Nothing new under the sun comes to mind when pondering whether financial markets are truly free. Beyond all related conjecture, it remains a stubborn fact that markets have always behaved in a way to perplex the majority of participants.
Adding to the complexity of this rather standard fare, are recent revelations that have clearly come to bare. Namely, an epic derivatives implosion, which candidly reveals that much of the financial sphere floats upon nothing more than the hollow intrigue of innovative means by which the elite plunder inordinate profits from the well baited and unsuspecting. This too, is nothing new, but rather a predictable recurrence of such grand consequence that it becomes impractical to veil in any other light.
Apart from the known risks, the historical travesty of stratagem deeply rooted in the financial markets will likely surge prior to coming full circle in lasting dissolution. Despite this, investors must continue to invest and traders shall continue to trade.
Nearing a Precipice or more Mountains yet to contrive
Wall Street's rather mature and surreptitious takeover of the real economy in concert with the bursting of an irresolvable daisy chain of derivatives has imposed a virulent mistrust throughout the financial sphere. Institutions, traders, and investors are now more uncertain than ever as to the durability of dependence upon financial innovation to grow the economy safely or efficiently over time. This leads one to ponder just how many contrived hills may lay ahead in reserve for mounting additional campaigns of familiar pillage.
Given the added fact that most all investment and speculation appears to be rooted upon a fictitious model of finance, what beyond empty pandering in the deceptive management of manufactured expectations might one assume reliable and trustworthy? At this stage, we suspect it is quite clear that all of the spin, reassurances, and cheerleading amounts to nothing more than a contemptible charade.
We have long ago resolved to cast aside trust in all such vacant assurances, alongside any illusory lowering of expectation benchmarks. “May the buyer beware”, stand as an ever-present axiom in guiding every facet of one's endeavors in the financial arena.
Now more than ever, reliance upon sound technical analysis cuts through the clamor of swelling paradox, and provides nimble clarity as to what markets are presently telegraphing, inclusive of their extending state of contrived ambiguity or resurgence.
TA provides a Unique Visual Study of History
Viewed through the prism of financial markets, technical analysis (TA) is an effectual study of world history and current events. To understand what is happening in the present, it is first essential to comprehend what has transpired in the past. To this end, there is no better model from which to capture the financial specter of world events than through the masterful framework of demarcation resident in Elliott Wave Theory.
Often, many dismiss the theory the instant a specific outcome of desire fails to manifest in textbook fashion. As with all chart analysis, Elliott Wave Theory is in part science, and a method of artistry. Like history, it is subjective, and as a result, most anyone who can count to five and recall the alphabet is bound to misinterpret the whole of its utility, tenets, and nuance.
How we Preserve Capital (long-term benefits)
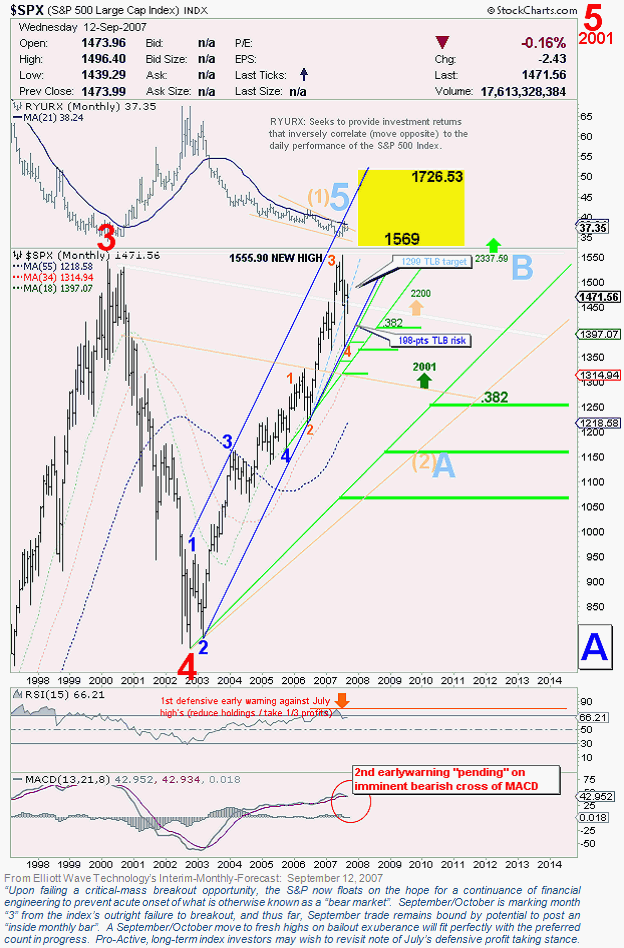
We have extracted the S&P 500 chart below from our Interim Monthly Forecast archive. The commentary beneath the chart, dispatched back on September 12, 2007, exemplifies the foresight and benefit that skillful dissemination of technical data bestows upon those with privy to such insights.
Of notable interest, boxed in yellow, is a previously forecast upside price-objective defining an anticipated range of achievement between 1569 and 1726. One month later, in October of 2007, the index would go on to register an all-time intraday high at 1576.09, ten points beyond threshold of the target window identified.
A second point of notable interest resides in the lower RSI panel. Two months prior, upon print of the July 1555.90 high, we recalled attention to July's dispatch, reminding readers of the early-warning defensive posture suggesting pro-active long-term investors to consider taking 1/3 rd high-level profits for the purpose of reducing long side exposure to a maturing market cycle.
The following month's report, dispatched October 2007, issued a second defensive warning against the 1576.09 all time high. In October, we again suggested pro-active investors take a 2 nd round of high-level profits in further reducing long side exposure to just 1/3 their original size.
By March of 2008, five months after registering an all time high, the S&P plummeted over 20%, near the deepest chart-noted .382-retracement level, shedding 319.11 points prior to printing a minor low at 1256.98. After trimming nearly 38% off the entire advance from the 2002 bear-market low, the market has since become largely ambiguous following unprecedented intervention by the statist Federal Reserve and associated banking cartels.

How we Identify Speculative Profits (short-term benefits)
In a broad philosophical sense, it matters greatly to us that the markets trade freely. However, if markets are indeed contrived, it matters not by whom, or what forces may control such travesty, but rather we possess a dependable means by which to identify profits amid either circumstance.
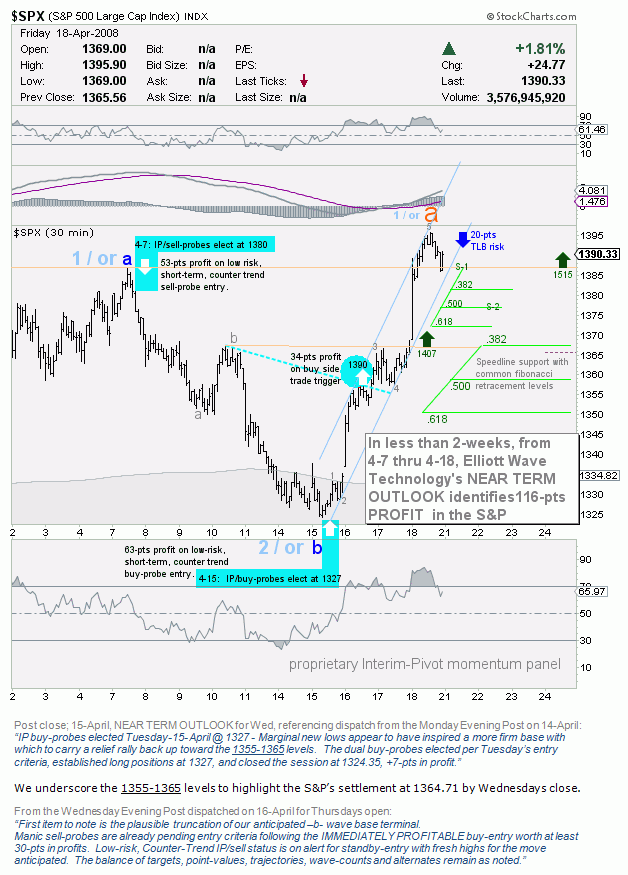
We have taken the intraday S&P 500 chart below, directly from our most recent Near Term Outlook publication.
The text supplied beneath the chart is NOT that posted with Friday's Evening Post dispatch, but rather from preceding commentaries provided earlier in the week.
We publish the NTO twice per week along with three supplementary Evening Post Reports, which provides our readership with five days per week of seamless coverage of the major equity indices.
End of Week Surge
To be perfectly candid, we had anticipated neither the speed nor amplitude achieved in Friday's rally.
We had in place however, the noted buy-trigger capturing 34-pts in profit upon trading past its1390 target, along with recently elected counter-trend entries, which opened long positions on Wednesday from the 1327 level.
Flush with abundance in short-term profits by weeks-end, and despite odds of further highs in the days ahead, we are now suggesting a more defensive posture for our short-term clients.

Origin of Elliott Wave Theory
In the late 1920's, Ralph Nelson Elliott, an astute, well respected, highly sought after businessman, developed what is today widely accepted as the broadest, most comprehensive, and compelling theories in the behavioral, and mathematical study of financial markets.
Through his hidden genius, and keen observation, Elliott labored incessantly in a quest to quantify that price fluctuations in the broad stock market, (previously accepted to behave in chaotic or random fashion) exhibited a hidden, consistent, and predictable order. He aptly described such repetitive price fluctuations as "waves”.
He concluded that a fractal order, or repetitive cycle, expressed a broad reflection of investor s' collective, varied, and vacillating emotions. The sequential price patterns he identified, particularly those, which mark terminals at Cycle Degree and higher, are in effect, historical footprints, revealing precisely what stage of dynamic advance, or pause, that markets have recorded throughout the entire course of financial history.
Through his tenacious effort in the identification of sequential patterns at (9) varying degrees of trend, along with an organizational set of tenets, and guidelines, ultimately leading to a thorough cataloging of his findings, Ralph Nelson Elliott achieved the seemingly impossible. Not only did he succeed in quantifying that markets do indeed trade in repetitive cycles, but he left behind numerous journals of his extraordinary achievements as a precious gift for future generations.
The Treasured Gift
For this gift of uncommon knowledge, we must impart full tribute to the efforts of Robert Prechter, and A.J Frost, who in 1978, collaboratively assembled and co-authored interpretation of Mr. Elliott's work in the first printing of the "Elliott Wave Principle" Key to Market Behavior.
Frost & Prechter' s translation of Elliott's' Masterworks can be described as nothing short of a brilliant expose, replete with market gauging principles base d on dynamic symmetry, rooted in mathematical law, and unbeknownst to Elliott at the time, in full confluence with every element of Fibonacci's Summation Series at its core.
The fractal nature of Elliott 's' repetitive dynamic wave formations provides us with a richly textured and unique perspective as to the historical significance of all developed data series. The tenets convey to us with high probability, just how such history is most likely to have meaningful consequence on the present and future course of human endeavor.
Conclusion
In broader philosophical context, the historical study of capital markets through the lens of Elliott Wave is a most fascinating way in which to recognize, document, record, and most importantly to “anticipate" various stages of progress, downfall, and recovery across the whole of humankind.
The practical application of Elliott Wave Theory is unique in that no other method of technical analysis provokes deeper thought, retrospection, or fosters a rebirth of enlightenment imparted through the wisdom of ages. Nor does any other method of analysis provide comparable models for framing, monitoring, and formulating dynamic probability forecasts for current and future market conditions.
Should one have interest in acquiring access to our long-term technical analysis and/or utilizing our proprietary short-term market landscapes, we invite you to visit our web site for more information. For immediate access to broad market coverage in all time-horizons, one may subscribe directly to the Near Term Outlook .
Trade Better / Invest Smarter...
By Joseph Russo
Chief Editor and Technical Analyst
Elliott Wave Technology
Email Author
Copyright © 2008 Elliott Wave Technology. All Rights Reserved.
Joseph Russo, presently the Publisher and Chief Market analyst for Elliott Wave Technology, has been studying Elliott Wave Theory, and the Technical Analysis of Financial Markets since 1991 and currently maintains active member status in the "Market Technicians Association." Joe continues to expand his body of knowledge through the MTA's accredited CMT program.
Joseph Russo Archive |
© 2005-2022 http://www.MarketOracle.co.uk - The Market Oracle is a FREE Daily Financial Markets Analysis & Forecasting online publication.


