


The Most Dangerous Stock Market Chart in the World
Stock-Markets / Stock Markets 2014 Jan 26, 2014 - 06:56 AM GMTBy: Toby_Connor

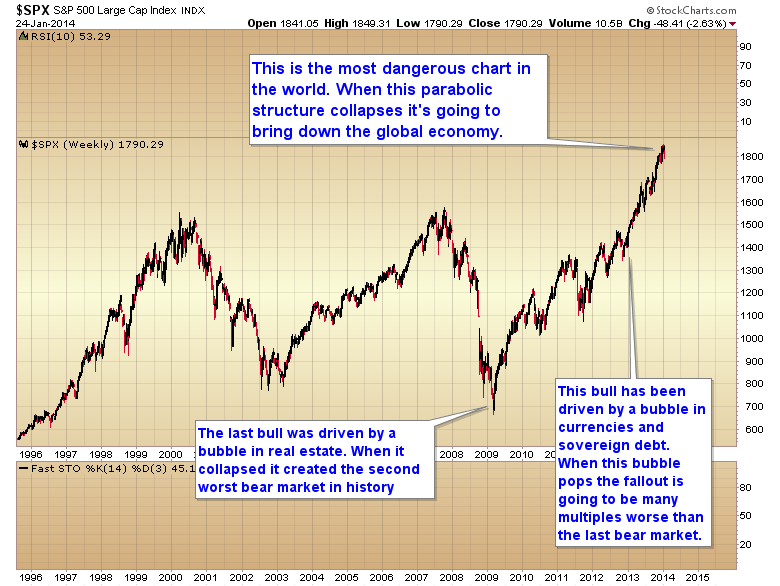
 Last month I warned about the bubble in the stock market, and what was going to happen when it popped. Make no mistake the chart of the S&P is the most dangerous chart in the world. When this parabolic structure collapses, it is going to bring down the global economy.
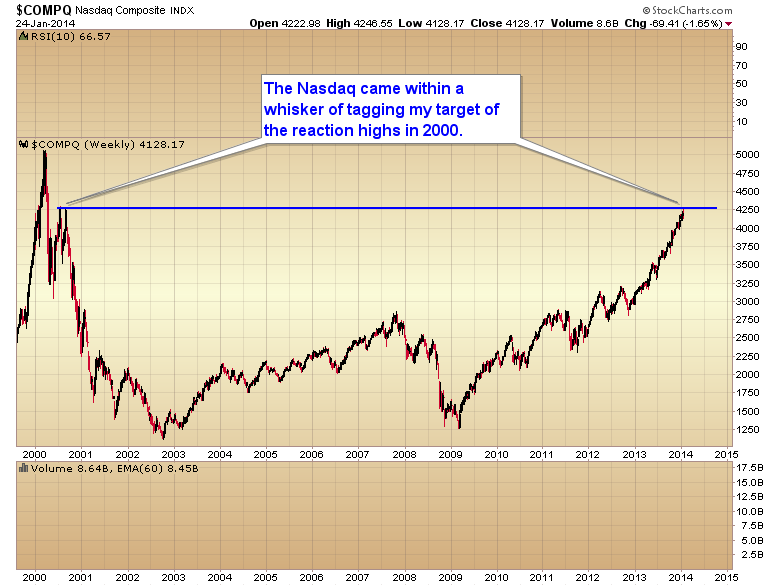
My initial target for this rally was a test of the reaction high on the NASDAQ in 2000. As you can see we came within just a whisker of hitting that target.
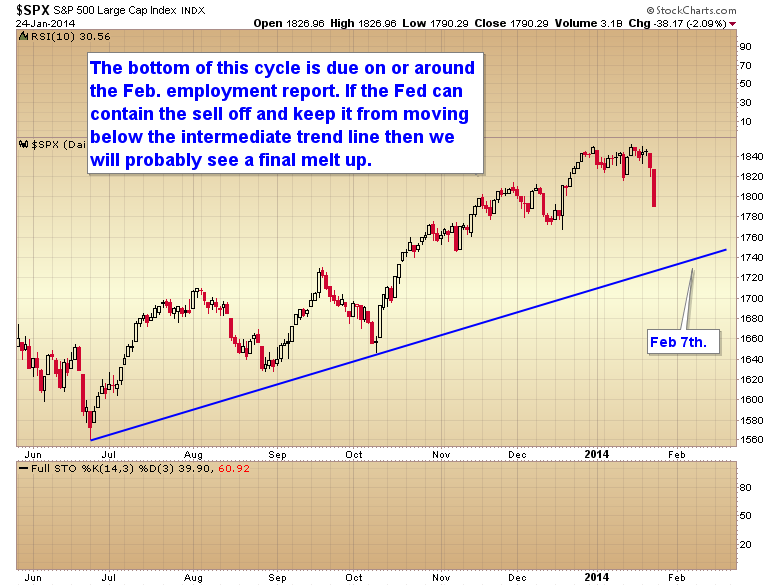
After what happened on Friday I think we can safely assume that the current daily cycle has now entered its declining phase. As I have noted before, the average duration trough to trough for the daily cycle in the stock market is 35-40 days. Friday was day 24. We should expect a bottom probably on the next employment report on February 7.
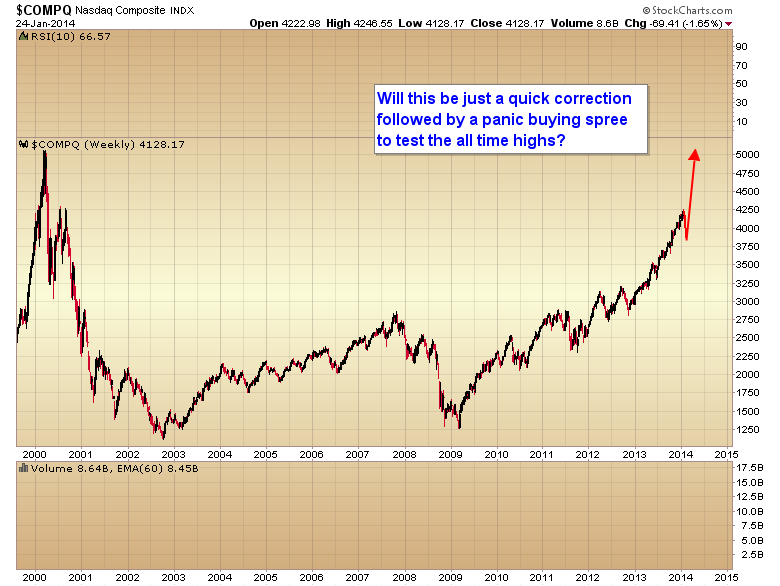
Now here's the thing, I expect the Fed, and the plunge protection team to go into full panic mode this weekend, come out Monday morning with guns blazing, and try to stop the sell off. Unfortunately this behavior is what has allowed this parabolic structure to develop. Every time the market has tried to correct over the last year the Fed has prematurely aborted the sell off. I'm pretty sure they are going to try again next week. If they succeed then we will probably have a final panic melt up phase with the NASDAQ testing the all-time highs above 5000 over the next 2-3 months.
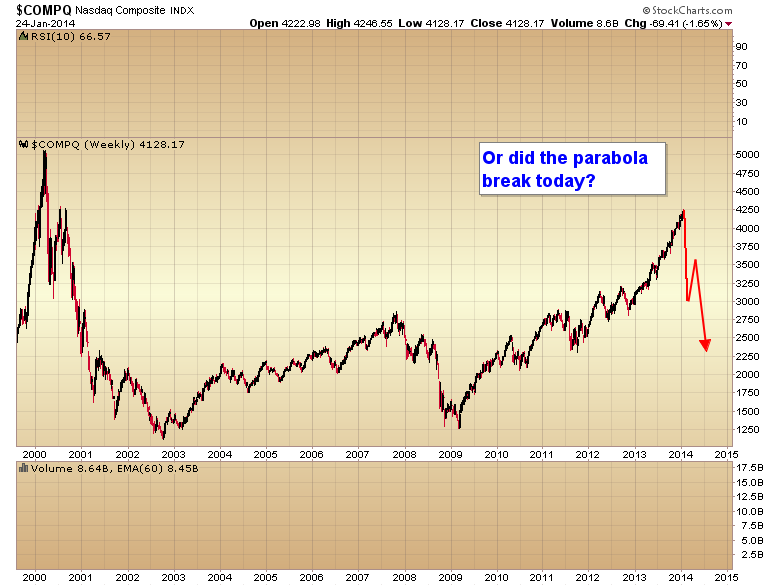
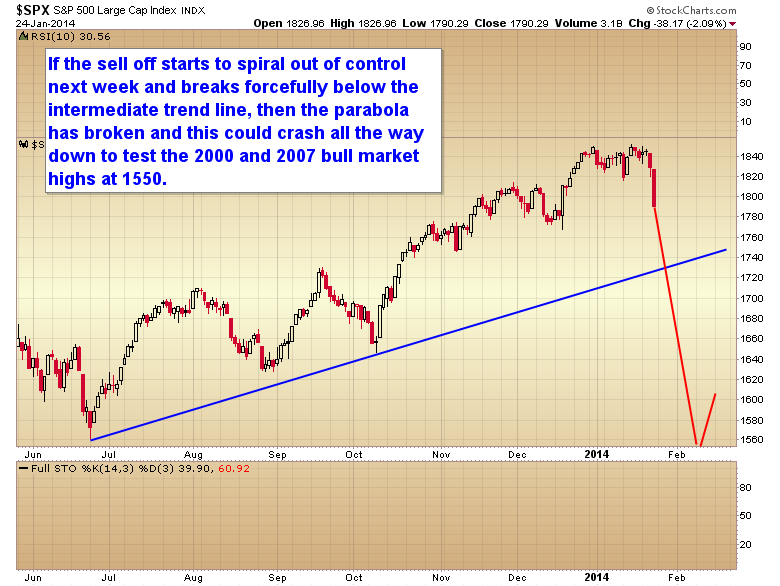
If on the other hand the selling pressure overwhelms the plunge protection team and starts to spiral out of control next week then we are witnessing the breaking of the parabola and the end of this bull market.
Here's what we need to watch next week. If the Fed can turn this market around and prevent the S&P from breaking through this intermediate trend line over the next two weeks, then this will turn into just a normal daily cycle correction and will be followed by a fifth daily cycle that should include the melt up phase of this bull market.
If on the other hand the selling pressure overwhelms the plunge protection team's efforts to hold it back and breaks through that intermediate trend line early in the week then we are witnessing the collapse of the parabolic structure and I wouldn't expect it to stop until we reach the 2000 and 2007 previous bull market high support zone.
Back on January 3 I instructed my subscribers to buy long-term puts on the market to take advantage of the collapse as I knew it was eventually coming. We should know by early next week whether or not those puts are going to pay off huge in the next two weeks or whether we will take a modest profit and reenter them at NASDAQ 5000.
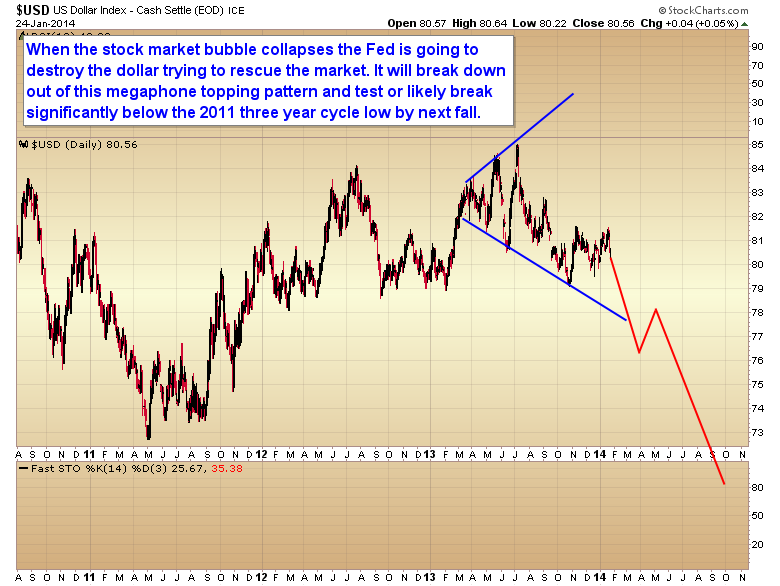
Whether the parabolic structure collapses next week or in two months we all know what the Feds response is going to be. They are going to reverse their taper decision and double or triple down on QE. The problem is that when a parabolic structure collapses it can't be put back together. My theory all along has been that when the stock market bubble pops the Fed would then completely destroy the dollar trying to pump it back up and that liquidity would then flow into the commodity markets instead of the broken parabola of the stock market and create another inflationary event similar to 2008.
Those people that say we have to have wage and employment growth in order to generate inflation are ignoring recent history. We had a severe inflationary event in 2008 while the economy was already in recession and unemployment was surging.
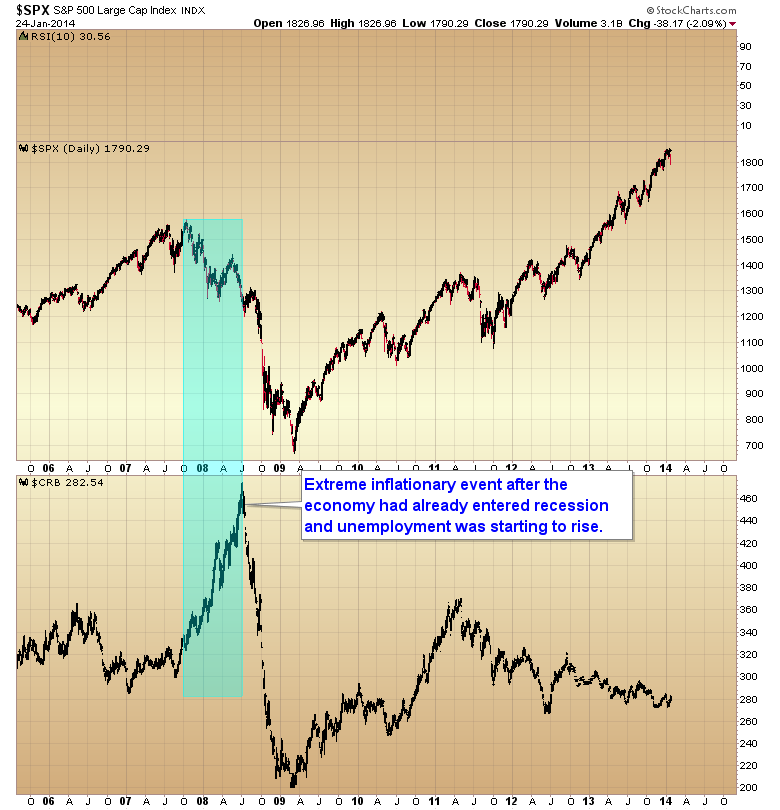
You don't need wage growth to have inflation. You just need a central bank to destroy your currency. The Fed has already destroyed our currency. At the moment the inflation is being stored in the stock market, bond market, and echo bubble in the real estate market. When those bubbles pop the inflation is going to flow back into the commodity markets.
Toby Connor
Gold Scents
GoldScents is a financial blog focused on the analysis of the stock market and the secular gold bull market. Subscriptions to the premium service includes a daily and weekend market update emailed to subscribers. If you would like to be added to the email list that receives notice of new posts to GoldScents, or have questions,email Toby.
© 2014 Copyright Toby Connor - All Rights Reserved
Disclaimer: The above is a matter of opinion provided for general information purposes only and is not intended as investment advice. Information and analysis above are derived from sources and utilising methods believed to be reliable, but we cannot accept responsibility for any losses you may incur as a result of this analysis. Individuals should consult with their personal financial advisors.
Toby Connor Archive |
© 2005-2022 http://www.MarketOracle.co.uk - The Market Oracle is a FREE Daily Financial Markets Analysis & Forecasting online publication.