Most Popular
1. It’s a New Macro, the Gold Market Knows It, But Dead Men Walking Do Not (yet)- Gary_Tanashian
2.Stock Market Presidential Election Cycle Seasonal Trend Analysis - Nadeem_Walayat
3. Bitcoin S&P Pattern - Nadeem_Walayat
4.Nvidia Blow Off Top - Flying High like the Phoenix too Close to the Sun - Nadeem_Walayat
4.U.S. financial market’s “Weimar phase” impact to your fiat and digital assets - Raymond_Matison
5. How to Profit from the Global Warming ClImate Change Mega Death Trend - Part1 - Nadeem_Walayat
7.Bitcoin Gravy Train Trend Forecast 2024 - - Nadeem_Walayat
8.The Bond Trade and Interest Rates - Nadeem_Walayat
9.It’s Easy to Scream Stocks Bubble! - Stephen_McBride
10.Fed’s Next Intertest Rate Move might not align with popular consensus - Richard_Mills
Last 7 days
Friday Stock Market CRASH Following Israel Attack on Iranian Nuclear Facilities - 19th Apr 24
All Measures to Combat Global Warming Are Smoke and Mirrors! - 18th Apr 24
Cisco Then vs. Nvidia Now - 18th Apr 24
Is the Biden Administration Trying To Destroy the Dollar? - 18th Apr 24
S&P Stock Market Trend Forecast to Dec 2024 - 16th Apr 24
No Deposit Bonuses: Boost Your Finances - 16th Apr 24
Global Warming ClImate Change Mega Death Trend - 8th Apr 24
Gold Is Rallying Again, But Silver Could Get REALLY Interesting - 8th Apr 24
Media Elite Belittle Inflation Struggles of Ordinary Americans - 8th Apr 24
Profit from the Roaring AI 2020's Tech Stocks Economic Boom - 8th Apr 24
Stock Market Election Year Five Nights at Freddy's - 7th Apr 24
It’s a New Macro, the Gold Market Knows It, But Dead Men Walking Do Not (yet)- 7th Apr 24
AI Revolution and NVDA: Why Tough Going May Be Ahead - 7th Apr 24
Hidden cost of US homeownership just saw its biggest spike in 5 years - 7th Apr 24
What Happens To Gold Price If The Fed Doesn’t Cut Rates? - 7th Apr 24
The Fed is becoming increasingly divided on interest rates - 7th Apr 24
The Evils of Paper Money Have no End - 7th Apr 24
Stock Market Presidential Election Cycle Seasonal Trend Analysis - 3rd Apr 24
Stock Market Presidential Election Cycle Seasonal Trend - 2nd Apr 24
Dow Stock Market Annual Percent Change Analysis 2024 - 2nd Apr 24
Bitcoin S&P Pattern - 31st Mar 24
S&P Stock Market Correlating Seasonal Swings - 31st Mar 24
S&P SEASONAL ANALYSIS - 31st Mar 24
Here's a Dirty Little Secret: Federal Reserve Monetary Policy Is Still Loose - 31st Mar 24
Tandem Chairman Paul Pester on Fintech, AI, and the Future of Banking in the UK - 31st Mar 24
Stock Market Volatility (VIX) - 25th Mar 24
Stock Market Investor Sentiment - 25th Mar 24
The Federal Reserve Didn't Do Anything But It Had Plenty to Say - 25th Mar 24

Market Oracle FREE Newsletter

How to Protect your Wealth by Investing in AI Tech Stocks

Stocks Peak One Year After Bonds, History Set to Repeat?

Stock-Markets / Financial Crash Feb 06, 2014 - 12:05 AM GMT

By: EWI

Stock-Markets Financial parallels between the 1920s and today

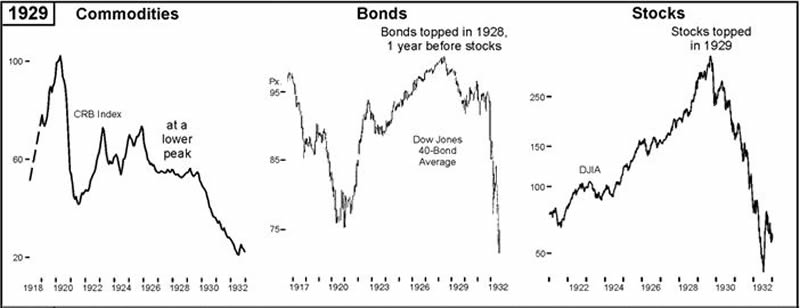
When the financial media mentions the late 1920s, they usually mean the 1929 stock market top. But today's investors can also learn from what happened in 1928. That was the year that the bond market topped, while commodities peaked even sooner.


You can see this for yourself in a chart published in the September 2013 issue of Robert Prechter's Elliott Wave Theorist.

In the deflationary collapse of 1929-32, commodities fell from lower peaks, not higher peaks; stocks fell from all-time highs down to the bottom; and bond prices fell from an all-time high a year earlier.

The Elliott Wave Theorist, July-August, 2013

These markets could see a similar outcome in the near future: Commodities peaked in 2008, while Treasury bonds topped in 2012. The high in the Dow Industrials remains December 31, 2013.

Of course, history doesn't always repeat itself. Whether December 31 proves to be a long-term high in the Dow remains to be seen. The stock market rally since March 2009 has been doggedly persistent. Prices have surged several times just as the indicators suggested the uptrend was over.


Bad Start for Stocks in 2014: Buying opportunity or more pain to come?
You can benefit greatly from looking at charts that take a historical look at what's going on in the financial markets. Robert Prechter has just released an issue of his Elliott Wave Theorist publication that includes 15 charts of the S&P 500, NASDAQ, gold, and mutual funds -- along with his analysis.

With this information, his Elliott Wave Theorist subscribers are now prepared for 2014. And you can be, too, because you can get the full 10-page issue, FREE.

Download your free 10-page report now >>

This article was syndicated by Elliott Wave International and was originally published under the headline Stocks Peak One Year After Bonds (History Set to Repeat?). EWI is the world's largest market forecasting firm. Its staff of full-time analysts led by Chartered Market Technician Robert Prechter provides 24-hour-a-day market analysis to institutional and private investors around the world.

About the Publisher, Elliott Wave International
Founded in 1979 by Robert R. Prechter Jr., Elliott Wave International (EWI) is the world's largest market forecasting firm. Its staff of full-time analysts provides 24-hour-a-day market analysis to institutional and private investors around the world.


© 2005-2022 http://www.MarketOracle.co.uk - The Market Oracle is a FREE Daily Financial Markets Analysis & Forecasting online publication.


Post Comment

Only logged in users are allowed to post comments. Register/ Log in