


Stock Market Trend Forecast Into Mid 2015
Stock-Markets / Stocks Bull Market Mar 01, 2014 - 07:00 PM GMTBy: David_Petch

 The S&P 500 Index is most likely to be in a topping pattern with an upside bias that lasts for at least another 18 months. This provocative thought is based upon the collective technical analysis of the S&P charts at different time frames (Daily, weekly and monthly), alongside the Elliott Wave count. There has been a comparison to 1987 and more recently, 1929 analog charts that suggest a very sharp decline in the broad stock market indices.
The chances of such a sharp decline occurring before 18 months (end of June 2015) is slim and more probable to occur at some point in September 2015. This time frame is based upon Elliott Wave analysis time considerations between wave structures from inter-market analysis. One of the main reasons that I examine gold, US Dollar, 3 currencies, oil, natural gas, AMEX Gold BUGS Index, AMEX Oil Index, S&P 500 Index, 10 Year US Treasury Index, Toronto Stock Exchange, Euro 350 iShares, Nikkei along with various exchange traded funds is to try and view the total picture of the landscape to see how everything is inter-related.
For new subscribers, back in July 2011, I observed a new market cycle coined "The Contracting Fibonacci Spiral" or CFS for short. When the maximum allowable time frame beyond May 21st 2013 before a sharp decline was expected passed, with no sharp decline, it indicated something else was going on (The CFS had logged in time points of 34, 13, 8 and 5 years, so chances of this cycle following its exact course to completion was highly probable). With no 3 year topping point logged in, I extended the cycle to note the chirality of the pattern and the fact it had a "chiral inversion". I strongly encourage anyone not familiar with these to papers (I did publish the CFS in the April 2013 issue of Stocks and Commodities Magazine) to Google my name (David Petch) alongside Contracting Fibonacci Spiral and Chiral Inversion. They do take some time to read, but knowledge is power and it will help so much to understand what lies ahead over the next 6 years.
Because the CFS was following a certain orientation for market tops since 1932 (higher highs at each time point), 2013 should have been a top, followed by 2016. With the chiral inversion that happened (cycle inversion), a low is expected in 2016 (3 years), followed by lower lows in 2018, 2019 and 2020 (2,1, 1 to complete the cycle). How low we fall remains to be determined, but the CFS pattern implies greater volatility as we approach the time zero point of the cycle...sometime in 2020.
Right now, everyone is trying to short the market, when everyone should be long dividend paying stocks, precious metal stocks and energy stocks. I want to note that biotech stocks have had a fantastic run and are likely to continue having more upside into 2016, but it will be one of the greatest sectors to short in 2015. Some famous speculator increased his bet that a 30% correction in the S&P occurs later this year, while others have diamond patterns with so many touch points up or down or a certain angle blah blah blah that suggest a top etc.
Anyone who wants to do any kind of technical analysis on the S&P, I suggest picking a few indicators, look at daily, weekly and monthly time frames and follow them. I wrote an article back in 2006 titled "The Technical Palette" that describes how I use Bollinger bands and full stochastics...I have come up with a few new observations, which will probably be reflected in the analysis seen within this article.
As many of you are probably being lulled to sleep, with only a brief sleep twitch spilling some hot coffee in hand to keep awake at this point, but the build up to understanding the analysis is important that you can get the most out of this article. Many of the concepts and expectations of how the market behaves in this article may be viewed as controversial and "out there", but development of the indicators I use has a strong mathematical basis, as does the CFS and chiral inversion patterns.
So far, I have updated 6/40 stocks we are going to be following and plan to update another 10 this weekend...the collection of stocks was already mentioned earlier this week and are comprised of precious metals, energy and some biotech stocks.
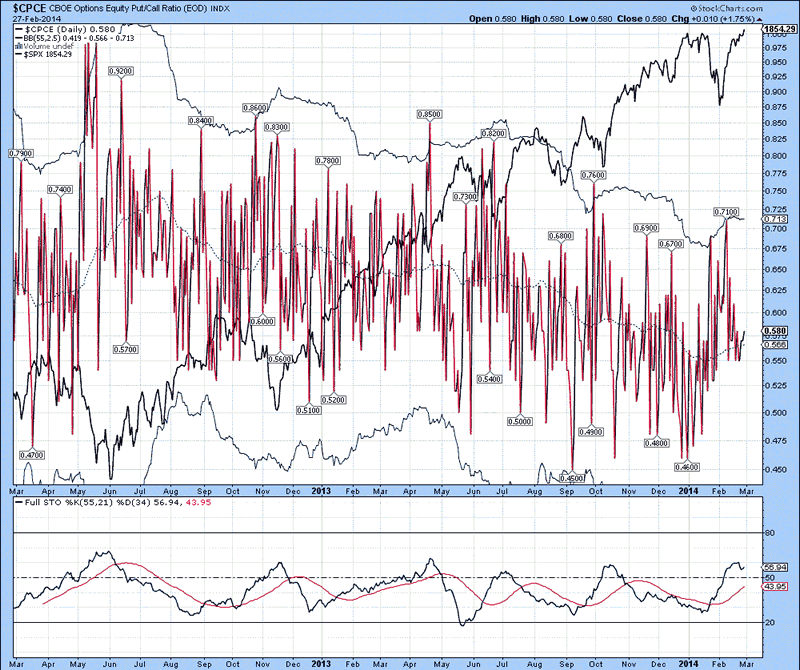
The daily chart of the CBOE Options Equity Put/Call Ratio is shown below, with the S&P 500 Index denoted in black. Since May 2013, the ratio has has formed a channel of declining tops, suggestive that the put/call ratio is declining with rising prices. This is to be expected over the next 18 months or so as the S&P continues to blindside most trying to short it. In the end, the ratio will decline to lower levels and baffle most as to why the markets have not turned down. For this chart and this chart only, the %K above the %D is a sign of weakness in the overall broad stock market indices, while a move beneath is a sign of strength. At present, the %K is above the %D with a rising market, out of trend with expectations. As analysis will suggest later, further sideways price action in the S&P could activate an inverse head and shoulders pattern that launches the index up at least 110 points beyond the 1850 level.
Figure 1
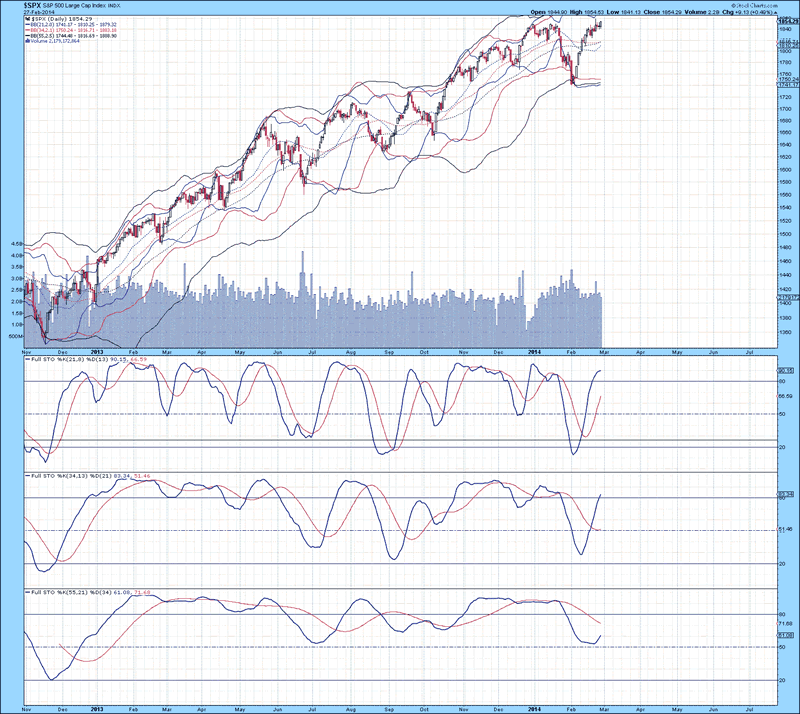
The daily chart of the S&P 500 Index is shown below, with the lower 21 MA Bollinger band beneath the 34 MA Bollinger band, indicating that an oversold condition as been generated. All three lower Bollinger bands are well beneath the current price, suggestive that further sideways to upward price action is likely to persist for at least another 3-4 weeks. Full stochastics 1, 2 and 3 are shown below in order of descent, with the %K above the %D in 1 and 2 and beneath the %D in 3. With the %K in stochastic 3 curling up, there is at least 3-4 weeks of further upside. There was a negative divergence between the %K in stochastic 1 and the S&P 500 Index, which has a measured move to 1900 if the 1840 level is taken out on a daily close. Further sideways price action over the course of the next 1-2 weeks would form an inverse head and shoulders pattern, which would add more strength to the short-term upside potential. Do not try and short the market at this point in time. As analysis will support, there is no indication that a top is going to be put in place for sometime. The worst case scenario that I see developing is a topping process that lasts another 12-18 months, with a greater emphasis on the 18 month time frame. The trading range expected is 1650-2000 between this time frame, more of which will be defined in Figures 5 and 6.
Figure 2
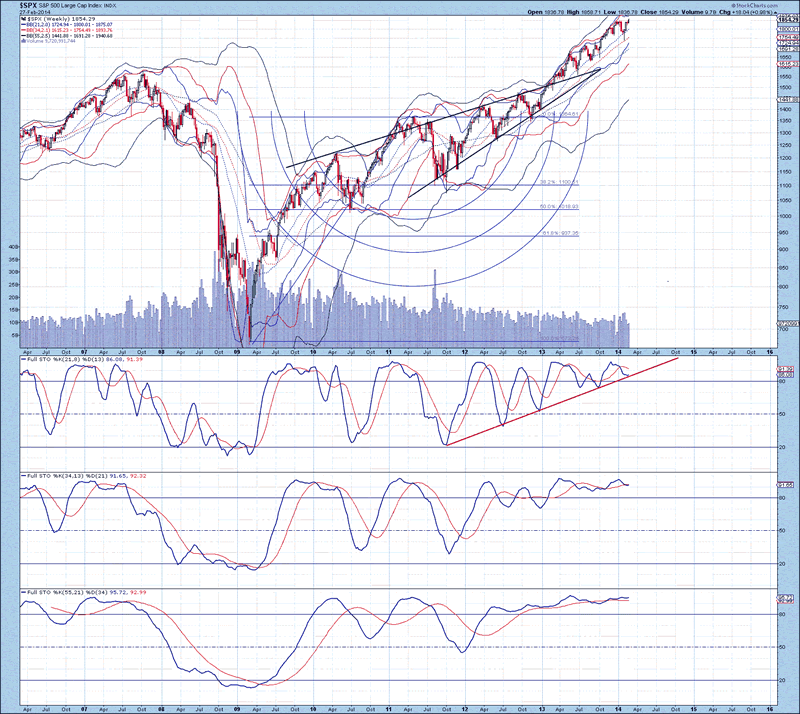
The weekly chart of the S&P 500 Index is shown below, with upper Bollinger bands continuing to rise above the current price, suggestive that a mid-term top is likely forming. Full stochastics 1, 2 and 3 are shown below in order of descent, with the %K beneath the %D in 1 and 2 and above the %D in 3. The S&P has had a pennant form from Octoberish 2011 until present, which has resulted in prices continuing to climb higher. The negative divergences between the %K of stochastics 1 and 2 for most of 2013 relative to the S&P 500 Index has a measured move to 1950-2000. This sort of move does not have to occur immediately, but remains a future target. The %K in stochastic 1 has been coiling since mid 2011, with a series of higher lows. I again want to point out that the Contracting Fibonacci Spiral Cycle that I discovered in July 2011 had a chiral inversion last summer, which suggested a cycle low sometime in Q2-Q3 2016. The basis of the cycle is that each subsequent correction becomes shorter in duration, but more intense. With a bottom not due for another 2.5 years, having a correction last for such a long period of time does not fit with the model. Given the long period of time for this upward trend since the 2008 bottom, a topping process is likely to last for at least 8-12 months. So far, there has been no such event, so it is safe to assume that completion of a topping process would not occur until at least this time in October 2014. I expect a correction to last another 5-7 months, followed by a final leg higher. There has been nothing but a series of higher lows and higher highs from 2009 until present, so from a structural perspective, there is no indication that a top has been put in place.
Figure 3
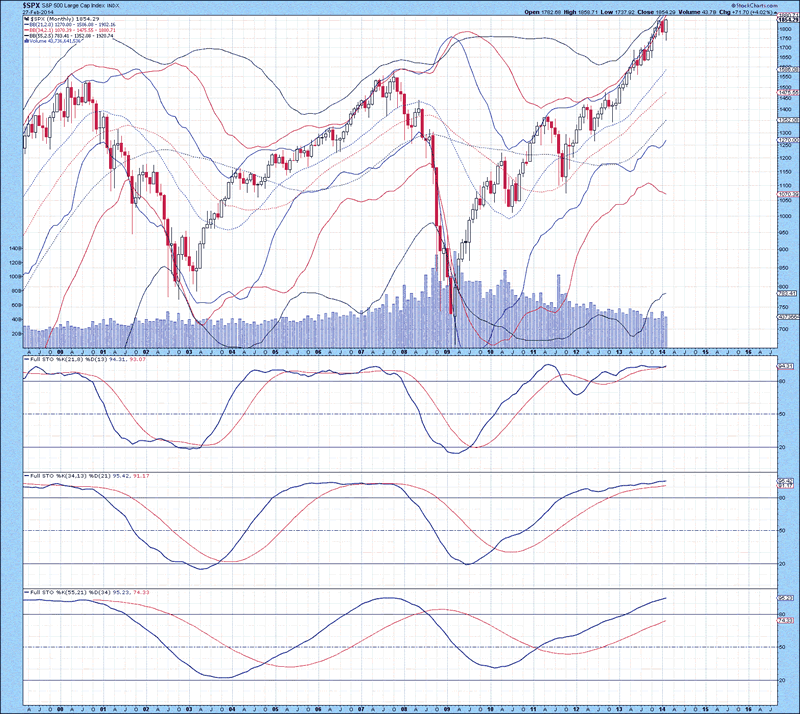
The monthly chart of the S&P 500 Index is shown below, with the upper 21 MA Bollinger band above the 34 MA Bollinger band, suggestive that an overbought condition is developing. The lower Bollinger band pattern developing is rather interesting...the lower 34 MA Bollinger band has yet to curl up, but the 55 MA Bollinger band has been rising since May 2013. When the lower 55 MA Bollinger band puts in a final rise, the smaller Bollinger bands should remain in a sideways to upward trend to indicate a contraction in volatility to indicate a longer-term topping process. The lower 34 MA Bollinger band being out of phase suggests the lower 55 MA Bollinger band will curl down one more time with a rising stock market. Also, if one examines the years 2000 or 2008, there was already a topping process well underway and no such event has yet occurred. This is further evidence that the broad stock markets of the US are not likely to put a top in place until Q2-Q3 2015. Full stochastics 1, 2 and 3 are shown below in order of descent, with the %K above the %D in all three instances. As per 2000 and 2008, the %K in stochastics 1 and 2 went sideways for an extended period of time. Given the amount of time consumed for the move from the 2009 bottom until present, the %K in stochastic 1 and 2 must cross below their %D lines in order to indicate a top has been put in place. Also, when the %K in stochastic 3 starts to roll over, it will indicate the start of a topping process or, a severe retraction in upward momentum. The most important thing to observe is the lower Bollinger bands are not in a configuration associated with a top. Lower 21 and 34 MA Bollinger bands MUST and I repeat MUST be rising together AFTER the lower 34 MA Bollinger band curls up. I can not stress this enough...this sort of observation will not be found anywhere, which is great for us. Using individual Bollinger bands or stochastics are useful, but much like a symphony, when more notes are thrown into the music sheet with different sections, a wonderful sound sensation occurs and draws out much more intensity and complexity. Music is auditory and below is visual, but the analogy holds true for when more indicators are added to observe the complex patterns that are present...they are clues and if recognized are invaluable. Based on the above, a topping process (supported by the Elliott wave count is around 18 months out).
Figure 4
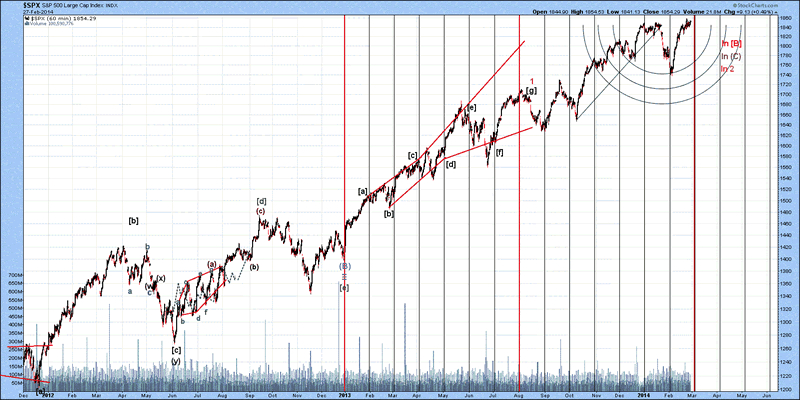
The mid-term Elliott Wave count of the S&P 500 Index is shown below, which has had the wave structure modified somewhat. I was playing with several wave structures, notably a diametric triangle from obvious and not so obvious start points. None of these jived and caused problems with the rules Glenn Neely laid down, so I came up with an alternate that seems to fit. The move up from the start of 2013 until present is part of the same wave structure, that should have 5 legs as a terminal impulse structure. Wave 1 really counts well as having 7 equal legs to form a diametric triangle, with wave 2 requiring until at least March before completing. This pattern fits well with anticipating a top due in Q2-Q3 2015 (most likely between August and September 2015). Implications of this pattern suggest wave 2-4 overlap, indicating a long-term topping pattern has already started and requires around 18 months to complete. Wave 1 was 8 months, and wave 2 requires to be 8 months at a minimum, so there is around 18-20 months of time remaining for waves 3, 4 and 5. Wave 2 appears to be completing an inverse head and shoulders pattern that would take the S&P 500 Index to 1950-1960. Because wave 1 is corrective, expect to see wave 4 overlap in price with wave 2, which could see a decline to as low as 1650. This wave count suggests a lot of volatility over the next 18 months. I believe a topping process is now underway, with the trading range between 1650-2050 over the next 12-18 months. The monthly chart observations are critical in providing clues that the broad stock market indices require a much longer period of time than anyone suspects before topping out.
Figure 5
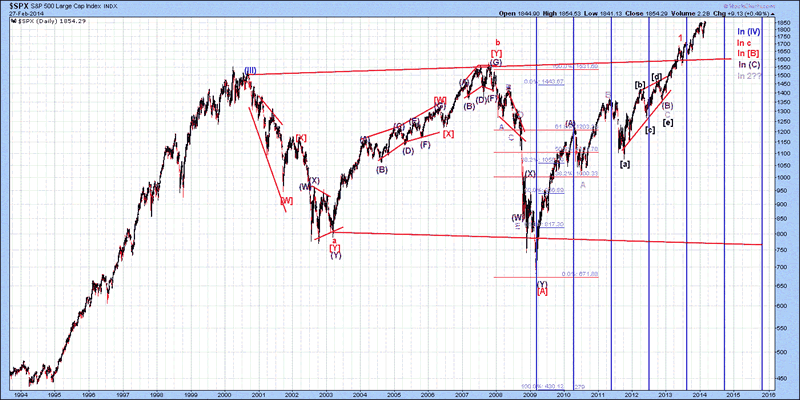
The long-term Elliott Wave count of the S&P 500 Index is shown below, with wave 2.(C).[B] thought to be forming at present. If the wave count develops as proposed, then wave [B] tops out in Q3 2015, followed by a decline in wave [C] that will either be impulsive in nature to complete wave c as a flat or be corrective and merely be wave [C].c of a triangle not expected to complete until 2020. The decline for wave [C] is likely going to be at or below the lower trend line established from the lower trend line (Notice that I did not use spike lows, as this can generate false, longer-term trend lines. Although the 2016 bottom will not likely go near the 2008 bottom, there is the potential for a move down to 750-800. If this were to happen, this would represent a 60-65% correction. Only time will tell what will truly happen, but under any other count that is possible for wave [B], the aftermath of its completion beyond Q2-Q3 of 2015 is grim. Based upon expected cycle lows of 2016, 2018, 2019 and 2020, it is highly probable that wave [C] is going to be a terminal impulse in nature (3-3-3-3-3). There appears to be a balance in the CFS cycle by time points 34, 21, 13, and 8 following a certain orientation (+), and time point 5 serving as the centre point. Remaining time points 3, 2, 1 and 1 following a (-) orientation suggest lower lows from 2016, 2018, 2019 and 2020. There will be many opportunities to make money being long or short for specific durations of time and the CFS pattern is most likely to prove to be the most accurate cycle to define the next 6 years.
Figure 6
That is all for today...back tomorrow with an update of the TSE, Euro 350 iShares and the TNX. Also, I will be updating 10 other stocks at some point this weekend.
By David Petch
http://www.treasurechests.info
I generally try to write at least one editorial per week, although typically not as long as this one. At www.treasurechests.info , once per week (with updates if required), I track the Amex Gold BUGS Index, AMEX Oil Index, US Dollar Index, 10 Year US Treasury Index and the S&P 500 Index using various forms of technical analysis, including Elliott Wave. Captain Hook the site proprietor writes 2-3 articles per week on the “big picture” by tying in recent market action with numerous index ratios, money supply, COT positions etc. We also cover some 60 plus stocks in the precious metals, energy and base metals categories (with a focus on stocks around our provinces).
With the above being just one example of how we go about identifying value for investors, if this is the kind of analysis you are looking for we invite you to visit our site and discover more about how our service can further aid in achieving your financial goals. In this regard, whether it's top down macro-analysis designed to assist in opinion shaping and investment policy, or analysis on specific opportunities in the precious metals and energy sectors believed to possess exceptional value, like mindedly at Treasure Chests we in turn strive to provide the best value possible. So again, pay us a visit and discover why a small investment on your part could pay you handsome rewards in the not too distant future.
And of course if you have any questions, comments, or criticisms regarding the above, please feel free to drop us a line . We very much enjoy hearing from you on these items.
Disclaimer: The above is a matter of opinion and is not intended as investment advice. Information and analysis above are derived from sources and utilizing methods believed reliable, but we cannot accept responsibility for any trading losses you may incur as a result of this analysis. Comments within the text should not be construed as specific recommendations to buy or sell securities. Individuals should consult with their broker and personal financial advisors before engaging in any trading activities as we are not registered brokers or advisors. Certain statements included herein may constitute "forward-looking statements" with the meaning of certain securities legislative measures. Such forward-looking statements involve known and unknown risks, uncertainties and other factors that may cause the actual results, performance or achievements of the above mentioned companies, and / or industry results, to be materially different from any future results, performance or achievements expressed or implied by such forward-looking statements. Do your own due diligence.
Copyright © 2014 treasurechests.info Inc. All rights reserved.
Unless otherwise indicated, all materials on these pages are copyrighted by treasurechests.info Inc. No part of these pages, either text or image may be used for any purpose other than personal use. Therefore, reproduction, modification, storage in a retrieval system or retransmission, in any form or by any means, electronic, mechanical or otherwise, for reasons other than personal use, is strictly prohibited without prior written permission.
David Petch Archive |
© 2005-2022 http://www.MarketOracle.co.uk - The Market Oracle is a FREE Daily Financial Markets Analysis & Forecasting online publication.