


Gold Miners Index: Domed House and Three Peaks Chart Pattern
Commodities / Gold and Silver Stocks 2014 Apr 08, 2014 - 10:03 AM GMTBy: Trader_MC

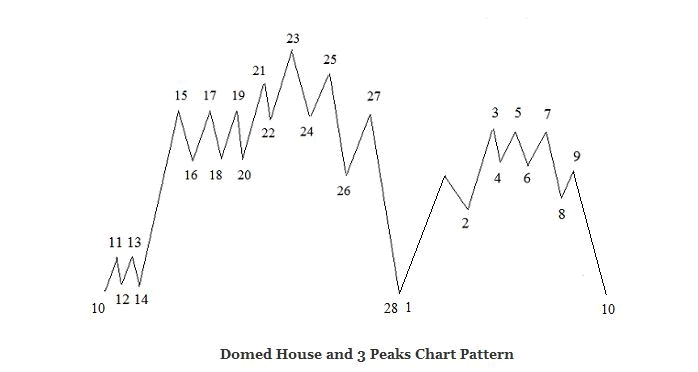
 The Miners Index has made a perfect Domed House and Three Peaks Chart Pattern. This pattern, discovered by a stock market analyst, George Lindsay, can be found in multiple timeframes. On the following charts you can see the model of the Lindsay’s Domed House and Three Peaks Pattern, as well as the current chart of the Miners Index (HUI). You can notice that the HUI Index has made a perfect Domed House and Three Peaks Pattern during these last ten years.
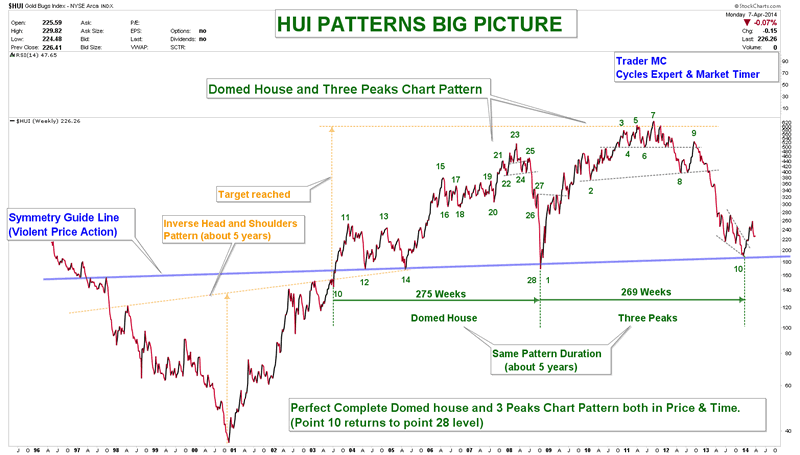
On the right side of the HUI Patterns Big Picture chart you can see that the three peaks (3-5-7) were followed by two strong waves decline into point 10. This down move defined the “separating decline” as prices separate the Three Peaks from the rest of the formation. Point 10 returned to point 28 and prices rebounced strongly on the Symmetry Guide Line as they normally do.
You can also notice that the Domed House Pattern (275 weeks) lasted almost for exactly the same period as the Three Peaks Pattern (269 weeks). The Domed House and Three Peaks Pattern is now complete as final point 10 returns to points 28-1 level. I have been following this pattern for a long time and it is important to monitor such chart formation as it plays an important role in the market.
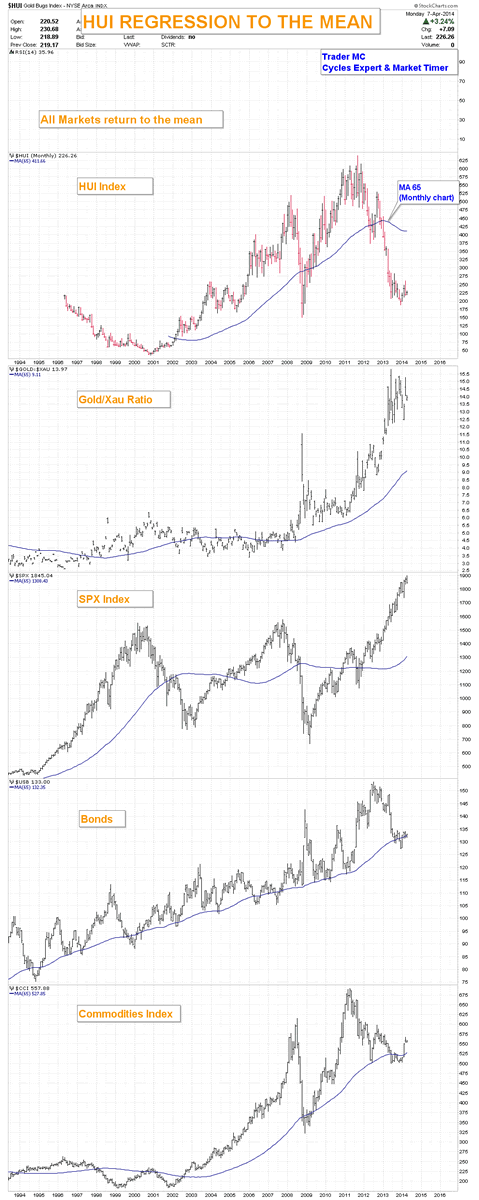
As you can see, both the Domed House and the Three Peaks Patterns have violent up moves, followed by strong reversals. In order to understand how the market works, it is important to keep in mind that all markets return to the mean. On the charts below you can see that the HUI Index, the Gold/XAU ratio and the SPX are far stretched from the 65 Monthly Moving Average. Every time it happened in the past, it generated a violent regression move which is a normal reaction for a market that has been too extreme. (I also included the Bonds and the Commodities charts as additional examples.) These charts are suggesting that odds favor an upside move for the Miners and a correction for the SPX Index on the intermediate term trend.
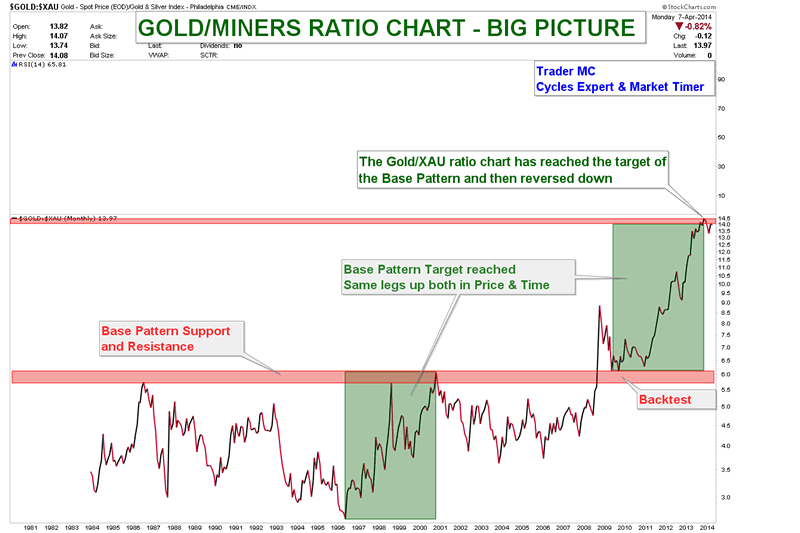
The next chart shows that the Gold/XAU ratio has reached its Base Pattern target and has a lot of downside potential. The vertical moves show how badly the Miners have performed to Gold these last two years. A regression to the mean may result in a violent down move and the Precious Metal stocks could strongly outperform the Gold Metal.
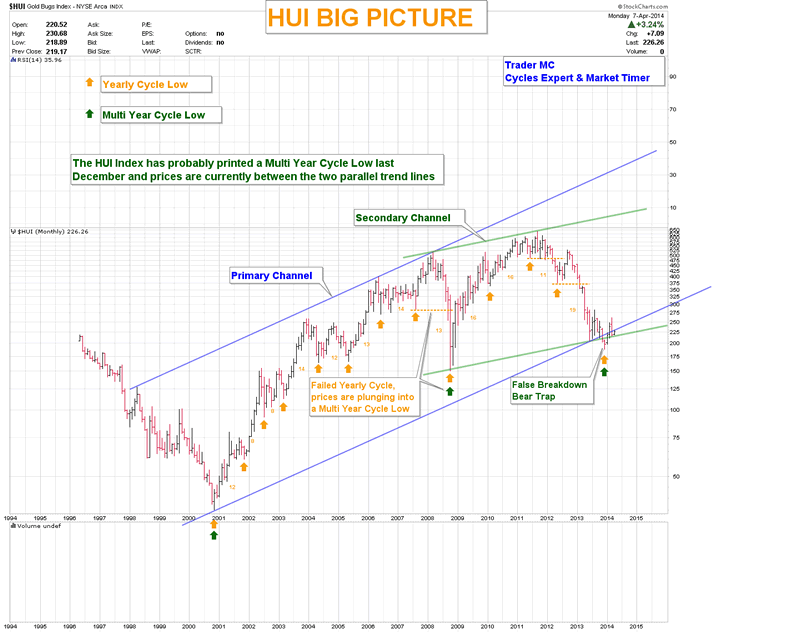
Here is another chart of the HUI Index where you can see that prices are between the two major parallel trend lines. The false breakdown last December looks like a bear trap and could have been a Multi-Year Cycle Low as it was late in the timing band for the HUI to print a Yearly Cycle Low. The lower blue trend line of the primary channel is still acting as a resistance and needs to be monitored closely. If prices go back into the blue channel, it would be a bullish sign for Miners.
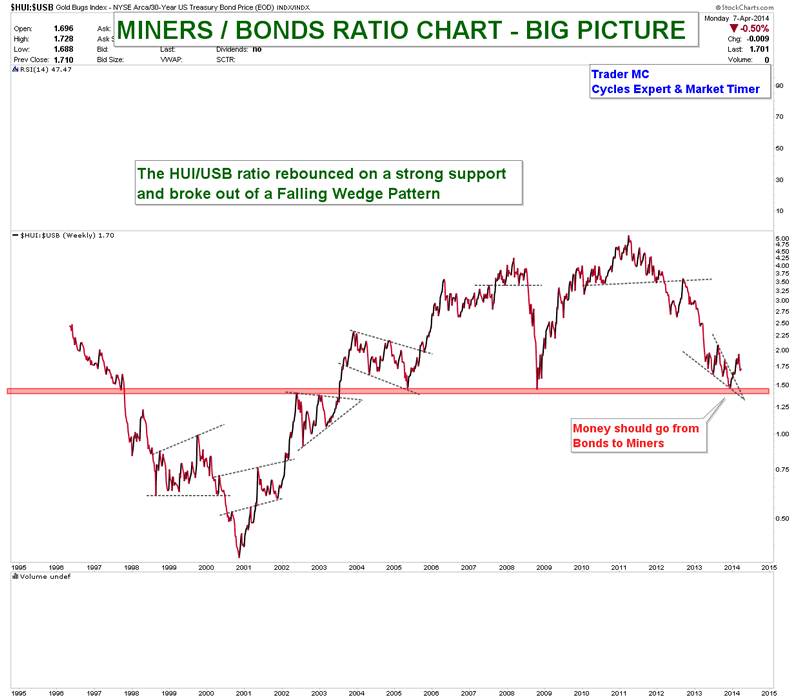
Next is the Miners/Bonds ratio chart. You can see that the HUI/USB ratio rebounced on a strong support and broke out of a falling wedge. Miners are outperforming Bonds and I expect more and more investors to leave the Bonds sector and to come into Miners during the coming months.
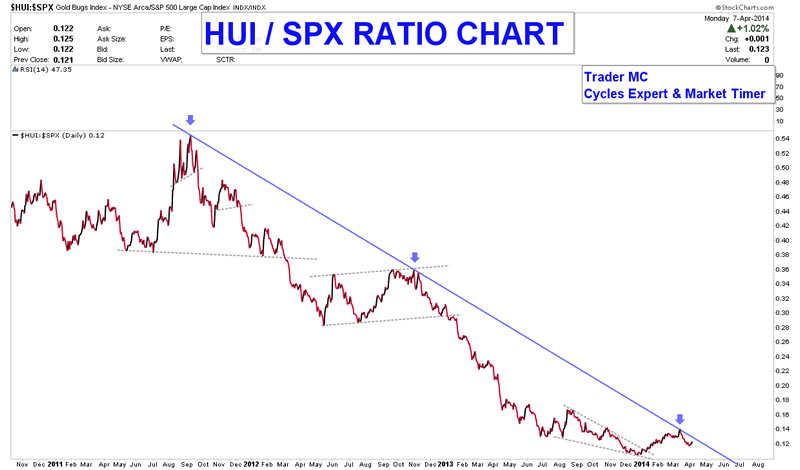
It is also interesting to keep an eye on the HUI/SPX ratio chart. Once a breakout of the resistance trend line occurs, Miners will be more attractive for the investors than the SPX Index. The HUI/SPX ratio got rejected right on the resistance trend line last month but the next attempt could be a successful one.
Irrationally low prices are the greatest opportunities for the investors, as all markets return to the mean. For the moment, I think that we have a decent bottom in place but nobody can predict the markets with 100% accuracy as they are irrational and like to push things to the extreme. I therefore cannot rule out the possibility of one more down move in Miners – in order to bring extreme pessimism – but if it happens then I expect it to be very brief, as the regression to the mean forces should play out and that would result in a great buying opportunity.
Trader MC
Company: Cycle Trader MC OU
Web site: http://tradermc.com
Email: contact@tradermc.com
My analysis covers different assets – Market Indexes, such as US, Europe, Emerging Markets, China, Russia etc., Commodities, Currencies (Forex Trading), Bonds and Rates. In addition to the Markets Updates for MC Members, I also post real-time Trading Alerts for MC Leveraged Members for a more aggressive strategy in all the sectors. Besides the market analysis, this site also contains Cycles Count Updates for all Market Assets, including the Forex Market.
© 2014 Copyright Trader MC - All Rights Reserved
Disclaimer: The above is a matter of opinion provided for general information purposes only and is not intended as investment advice. Information and analysis above are derived from sources and utilising methods believed to be reliable, but we cannot accept responsibility for any losses you may incur as a result of this analysis. Individuals should consult with their personal financial advisors.
© 2005-2022 http://www.MarketOracle.co.uk - The Market Oracle is a FREE Daily Financial Markets Analysis & Forecasting online publication.