


Inside the Latest U.S. Jobs Report - Nonfarm Payrolls +288,000, Unemployment Rate Drops to 6.3%...
Economics / Employment May 04, 2014 - 10:46 AM GMTBy: Mike_Shedlock

 Initial Reaction
This month sported another amazing difference between the household survey and the payroll survey. The difference is so vast that looking at the numbers in isolation, one might think the results were from two different countries.
The headline number from the payroll survey beat expectations by a mile with 288,000 jobs, but beneath the surface, the household survey shows employment declined by 73,000.
April BLS Jobs Statistics at a Glance
- Nonfarm Payroll: +288,000 - Establishment Survey
- Employment: -73,000 - Household Survey
- Unemployment: -733,000 - Household Survey
- Involuntary Part-Time Work: +54,000 - Household Survey
- Voluntary Part-Time Work: -330,000 - Household Survey
- Baseline Unemployment Rate: -0.4 at 6.3% - Household Survey
- U-6 unemployment: -0.4 to 12.3% - Household Survey
- Civilian Non-institutional Population: +181,000
- Civilian Labor Force: -806,000 - Household Survey
- Not in Labor Force: +988,000 - Household Survey
- Participation Rate: +0.2 at 62.8 - Household Survey
- The unemployment rate varies in accordance with the Household Survey, not the reported headline jobs number, and not in accordance with the weekly claims data.
- In the past year the population rose by 2,260,000.
- In the last year the labor force rose by 62,000.
- In the last year, those "not" in the labor force rose by 2,203,000
- Over the course of the last year, the number of people employed rose by 1,993,000 (an average of 166,000 a month)
April 2014 Employment Report
Please consider the Bureau of Labor Statistics (BLS) April 2014 Employment Report.
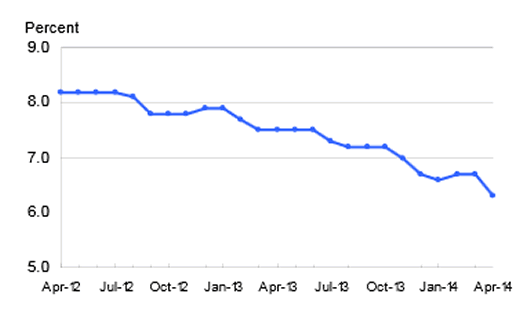
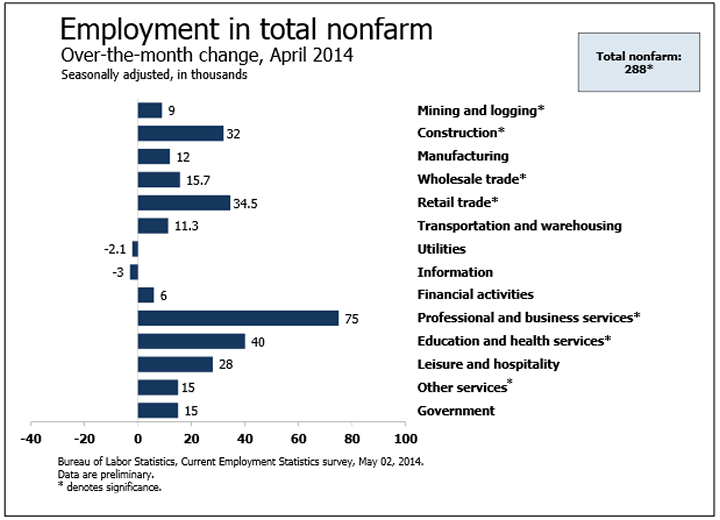
Total nonfarm payroll employment rose by 288,000, and the unemployment rate fell by 0.4 percentage point to 6.3 percent in April, the U.S. Bureau of Labor Statistics reported today. Employment gains were widespread, led by job growth in professional and business services, retail trade, food services and drinking places, and construction.
Unemployment Rate - Seasonally Adjusted
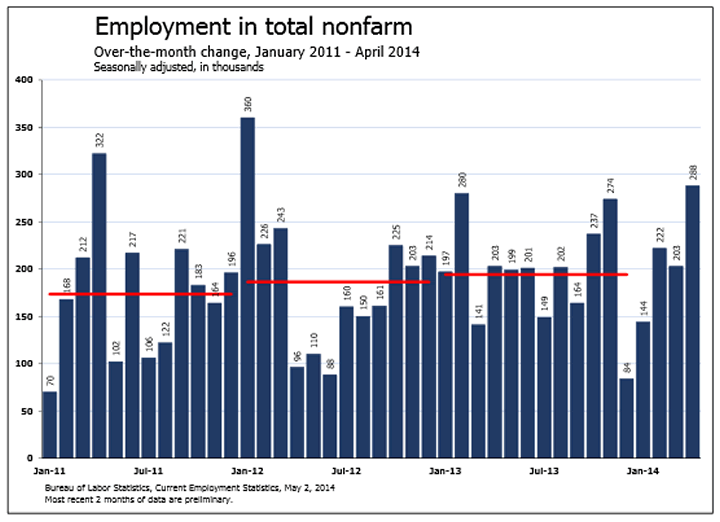
Nonfarm Employment January 2011 - April 2014
Nonfarm Employment Change from Previous Month by Job Type
The establishment survey gain is the largest 1-month gain since January 2012. Nonfarm employment remains just 113,000 below its January 2008 peak.
Hours and Wages
Average weekly hours of all private employees was flat at 34.5 hours. Average weekly hours of all private service-providing employees was flat at 33.3 hours.
Average hourly earnings of private workers rose $0.03 to $20.50. Average hourly earnings of private service-providing employees rose $0.02 to $20.28.
For further discussion of income distribution, please see What's "Really" Behind Gross Inequalities In Income Distribution?
Birth Death Model
Starting January, I dropped the Birth/Death Model charts from this report. For those who follow the numbers, I keep this caution: Do not subtract the reported Birth-Death number from the reported headline number. That approach is statistically invalid. Should anything interesting arise in the Birth/Death numbers, I will add the charts back.
Table 15 BLS Alternate Measures of Unemployment
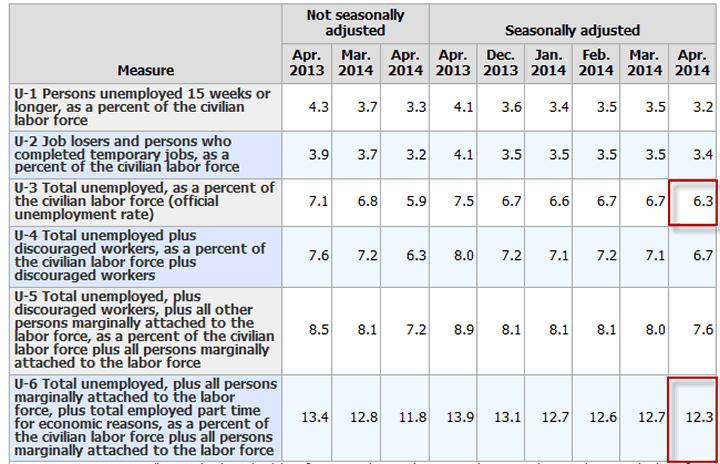
Table A-15 is where one can find a better approximation of what the unemployment rate really is.
Notice I said "better" approximation not to be confused with "good" approximation.
The official unemployment rate is 6.3%. However, if you start counting all the people who want a job but gave up, all the people with part-time jobs that want a full-time job, all the people who dropped off the unemployment rolls because their unemployment benefits ran out, etc., you get a closer picture of what the unemployment rate is. That number is in the last row labeled U-6.
U-6 is much higher at 12.3%. Both numbers would be way higher still, were it not for millions dropping out of the labor force over the past few years.
Labor Force Factors
- Discouraged workers stop looking for jobs
- People retire because they cannot find jobs
- People go back to school hoping it will improve their chances of getting a job
- People stay in school longer because they cannot find a job
- Disability and disability fraud
Were it not for people dropping out of the labor force, the unemployment rate would be well over 9%.
Synopsis
Last month, weather-related effects were taken back and then some. This month we see a return to the divergence between the household survey and the establishment survey. +288,000 vs. -73,000 is massive. So is the decline in labor force of 800,000. That is the only reason the unemployment rate declined. All things considered, this was not a good report.
By Mike "Mish" Shedlock
http://globaleconomicanalysis.blogspot.com
Click Here To Scroll Thru My Recent Post List
Mike Shedlock / Mish is a registered investment advisor representative for SitkaPacific Capital Management . Sitka Pacific is an asset management firm whose goal is strong performance and low volatility, regardless of market direction.
Visit Sitka Pacific's Account Management Page to learn more about wealth management and capital preservation strategies of Sitka Pacific.
I do weekly podcasts every Thursday on HoweStreet and a brief 7 minute segment on Saturday on CKNW AM 980 in Vancouver.
When not writing about stocks or the economy I spends a great deal of time on photography and in the garden. I have over 80 magazine and book cover credits. Some of my Wisconsin and gardening images can be seen at MichaelShedlock.com .
© 2014 Mike Shedlock, All Rights Reserved.
Disclaimer: The above is a matter of opinion provided for general information purposes only and is not intended as investment advice. Information and analysis above are derived from sources and utilising methods believed to be reliable, but we cannot accept responsibility for any losses you may incur as a result of this analysis. Individuals should consult with their personal financial advisors.
Mike Shedlock Archive |
© 2005-2022 http://www.MarketOracle.co.uk - The Market Oracle is a FREE Daily Financial Markets Analysis & Forecasting online publication.