


Stocks Bull Markets - Global Economic Coniditons are Just Right!
Stock-Markets / Stock Markets 2014 Jun 06, 2014 - 12:03 PM GMTBy: Puru_Saxena

 BIG PICTURE - The economies of the developed world are improving; their housing markets are on the rebound and unemployment rates are sliding. On the monetary front, central banks remain accommodative, interest rates are at historic lows and the yield curve is steep. Furthermore, inflationary pressures remain subdued in the vast majority of the developed nations; thereby exerting downward pressure on long dated interest rates.
Admittedly, the world's economy is notgrowing at breakneck speed and many investors are viewing this as a bad omen for the stock market. However, as we have explained previously, as an investor, you do not want the economy to expand at torrid pace; and in the current landscape, bad news is good news!
From our perspective, the current economic conditions are 'just right' for stock market investors. After all, business activity is expanding albeit slowly, bank credit is growing (Figure 1) and inflation remains low. Under this benign scenario, central banks are likely to remain accommodative for the foreseeable future and this is good news for the stock market.
Remember, when it comes to investing, monetary policy trumps everything else and the risk free rate of return determines the value of each and every asset.
Figure 1: US Bank Credit (2004-2014)
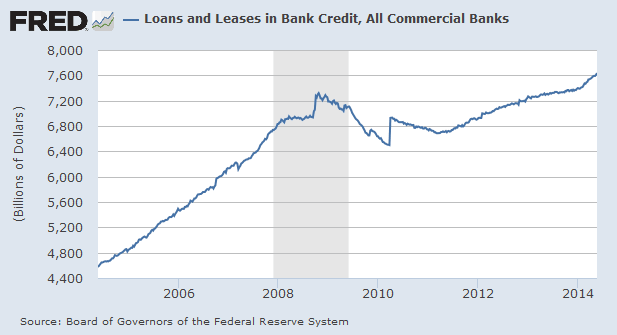
Source: St. Louis Fed
As long as business activity muddles along and inflationary expectations remain contained, short term interest rates will not increase and the yield curve will remain steep. This implies that the ongoing primary bull market in stocks will not be assassinated by the central banks anytime soon.
It is notable that in the past, every major bear market in stocks has been preceded by the inversion of the yield curve. Thus, it is reasonable to assume that the next bear market will also be triggered by the yield curve inversion.
Turning to the present situation, it is interesting to observe that after a multi-month trading range, the S&P500 Index has broken out to a new high and it is currently trading above the key moving averages (Figure 2).
Figure 2: S&P500 Index - record high!
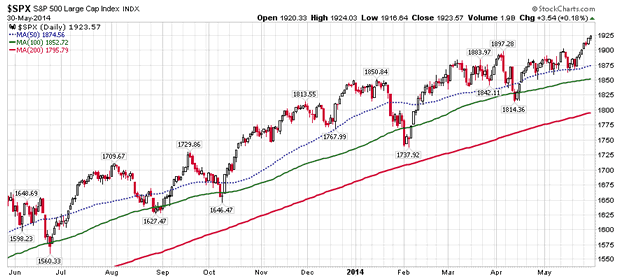
Source: www.stockcharts.com
Elsewhere, the Dow Jones Industrial Average has also climbed to a record high and even the NASDAQ Composite has reclaimed all the key moving averages. On the bearish side of the ledger, the Russell 2000 Growth Index is lagging the broad market and it is currently sitting right on the 200-day moving average.
If this nascent rally has legs, the growth stocks must also participate in the festivities, so we will continue to monitor the Russell 2000 Growth Index. In any event, there can be no denying the fact that we are now in a mature bull market; whereby only about half of the stocks are advancing. The other counters are either consolidating or they have already commenced their own private bear markets. This type of divergence is usually seen late in the cycle, so it is imperative that we keep ourselves aligned with the strongest stocks from within the favourable industry groups.
If you review the technical data, it is encouraging to note that the NYSE Advance/Decline Line has climbed to a record high, and this implies that the market's breadth remains strong. Historically, this indicator has always peaked several months before the commencement of a bear market, so the ongoing strength is a major plus. Elsewhere, it is worth noting that the new 52-week highs are significantly greater than the new 52-low week lows and approximately 70% of the stocks listed on the NYSE are currently trading above the 200-day moving average. In our view, all these are positive signs which suggest that the primary uptrend in common stocks will probably continue for the foreseeable future.
In terms of our managed portfolios, after impressive growth last year, our equity and fund strategies have underperformed the benchmark since early March. This is primarily due to the fact that the stock market has been very choppy over the past 3 months and under these volatile conditions, our trend-following programs have struggled. Fortunately, the multi-month trading range in the stock market has now ended and a new rally seems to be underway. Therefore, we are now confident that both our equity and fund portfolios will start delivering positive returns and catch up with the benchmark (MSCI World Index).
As far as sectors are concerned, we see ongoing strength in banks, consumer staples, energy, healthcare, housing and industrials. Accordingly, we have concentrated our equity portfolio in these promising areas.
In terms of geographical exposure, we continue to like Europe, Japan and the US. More recently, we have also turned bullish on India and invested some capital in the world's largest democracy.
If you review Figure 3, you will note that after a 4-year consolidation phase, the Bombay Sensex Index has recently broken out to a new high. Usually, such breakouts (after a brief pullback) tend to go on for several months, so this seems to be a good time to allocate some capital to Indian stocks.
Figure 3: India's stock market (weekly chart)
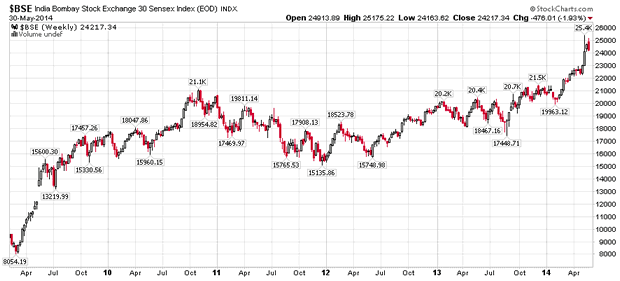
Source: www.stockcharts.com
Elsewhere in Asia, the vast majority of the stock markets are still caught in a lengthy trading range and they still have not surpassed the highs recorded several years ago. Over in the bearish camp, China's stock market has been a total disaster and even now, the Shanghai Composite Index is trading below the key moving averages. In the past, we have written extensively about China's housing bubble, so will not cover that topic in great detail in this month's Money Matters. What we will say though is that China's housing bubble is unsustainable, and similar to all debt-fueled booms of the past, this one will also burst. Therefore, from our perspective, this is not the time to be invested in Chinese assets.
COMMODITIES - After a three month advance, it appears as though the commodities complex has topped out and the path of least resistance is now down.
You will recall that primarily due to the strength in the agricultural patch, the Reuters-CRB (CCI) Index surged in January and the rally continued until March (Figure 4). Thereafter, a brief consolidation followed and the CCI put in a double-top in late April.
Since then, the CCI has faced significant selling pressure and it has already slipped below the 50-day moving average and sliced through the previous low. At present, the CCI is trading just above the 100-day moving average and there is a real risk of additional downside.
Figure 4: Reuters-CRB Index (daily chart)
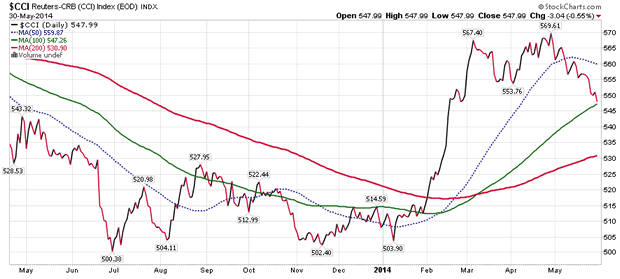
Source: www.stockcharts.com
Over in the agricultural space, it noteworthy that after a big rally, the prices of coffee, corn, sugar and wheat are sliding and sellers are now in control of this market. Remember, the agricultural complex is extremely volatile and big gains are usually followed by equally impressive busts! Accordingly, traders should either be 'short' or out of this area.
Amongst the industrial commodities, it is interesting to note that copper is still trading under the 200-day moving average and in our view, its trend remains down. Make no mistake; China is the biggest consumer of the metal, so its fortunes are directly correlated to the health of the Chinese housing market. If China's construction activity slows down, the price of copper will fall, perhaps significantly.
From a technical perspective, a close beneath US$3 per pound will be extremely bearish and it will open up the possibility of a waterfall decline.
In the energy patch, it is worth noting that the price of crude is holding steady, but we cannot help but think that this commodity is caught in a lengthy trading range. For now, crude oil is trading above all the key moving averages but we suspect that the next intermediate term move will be to the downside.
As far as the related stocks are concerned, we continue to see ongoing strength in the integrated energy firms, upstream companies, pipelines and refiners. Accordingly, in our equity and fund portfolios, we have allocated some capital to these securities.
If you review Figure 5, you will observe that the Oil Index (XOI) is acting well and it is currently trading above the key moving averages. Historically, the energy stocks have done well in the mature phase of a bull market, so exposure to this area is recommended until the inversion of the yield curve.
Figure 5: Oil Index - showing strength!
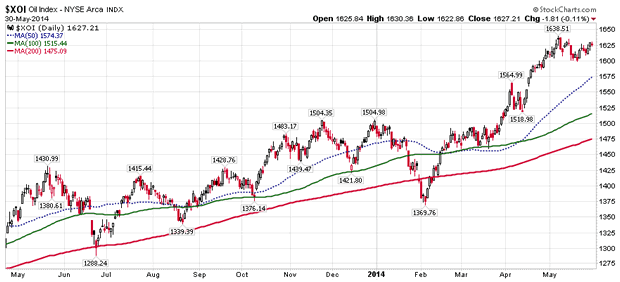
Source: www.stockcharts.com
Last but not least, despite the recent slide in the agricultural items, the related stocks are doing just fine and we advocate some exposure to the agricultural equipment, fertiliser and seed stocks. Similar to energy, the agricultural counters tend to do well during the latter phase of a bull market, so the rally is likely to continue for several months.
Puru Saxena publishes Money Matters, a monthly economic report, which highlights extraordinary investment opportunities in all major markets. In addition to the monthly report, subscribers also receive “Weekly Updates” covering the recent market action. Money Matters is available by subscription from www.purusaxena.com.
Puru Saxena
Website – www.purusaxena.com
Puru Saxena is the founder of Puru Saxena Wealth Management, his Hong Kong based firm which manages investment portfolios for individuals and corporate clients. He is a highly showcased investment manager and a regular guest on CNN, BBC World, CNBC, Bloomberg, NDTV and various radio programs.
Copyright © 2005-2014 Puru Saxena Limited. All rights reserved.
Disclaimer: The above is a matter of opinion provided for general information purposes only and is not intended as investment advice. Information and analysis above are derived from sources and utilising methods believed to be reliable, but we cannot accept responsibility for any losses you may incur as a result of this analysis. Individuals should consult with their personal financial advisors.© 2005-2022 http://www.MarketOracle.co.uk - The Market Oracle is a FREE Daily Financial Markets Analysis & Forecasting online publication.