


Gold Investors: Let This Cycle Be Your Guide
Commodities / Gold and Silver 2014 Jun 17, 2014 - 12:01 PM GMTBy: Frank_Holmes

 U.S. Global Investors recently welcomed Doug Peta, an economist from BCA research, to our offices. He presented some interesting research regarding the Fed Funds Rate Cycle, and in turn, what that research could mean for gold. I wanted to share points from his presentation, as well our own in-house research, to help you understand the positivity we see for the precious metal looking towards 2015.
Where are we now?
Below is a chart from BCA showing the Fed Funds Rate Cycle. In essence, this chart neatly illustrates what the interest rate cycle imposed by the U.S. Federal Reserve looks like. The red circle indicates where we are right now: Phase IV, also known as the "easing" phase of the monetary policy that was enacted in 2008 in the U.S., better known as quantitative easing (QE).
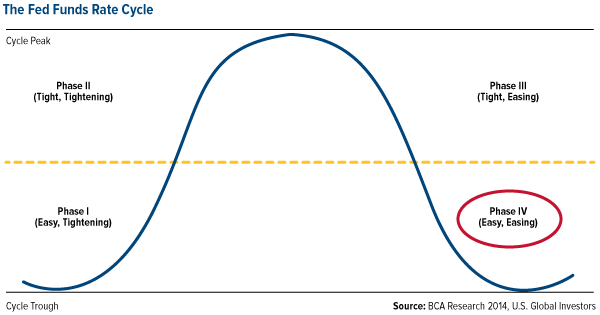
As we know, the Fed enacted QE to stimulate our nation's economy. Right now we're benefitting from our placement in Phase IV of this cycle because it is in this phase that the Fed is able to keep interest rates low, keep reserve requirements low and continue printing money. Similarly, when money is "easy," businesses can find funding for projects and consumers have easier access to credit.
Historically, Phase IV (as well as the shift towards Phase I) are the best for equity investors because stocks usually rise during these two positions in the cycle.
Why these phases are good for gold, too.
We have been in Phase IV of the Fed Funds Rate Cycle for a few years now, and are expected to remain here into 2015. Eventually the Fed will have to start tightening again and raise rates, although the numbers should remain relatively low for a while. Once this begins, we will move into Phase I.
When it comes to the performance of gold and gold stocks, history indicates good times are ahead based on where we are in the cycle. Take a look at the tables below showing median returns during the cycle dating back to 1970 and 1971. You'll see that for gold and gold stocks, Phase IV and Phase I both show the highest median returns.
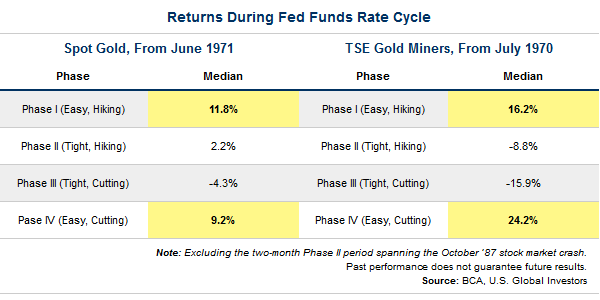
The reason for the high returns during these two phases is because of "easy money." Tight money, which is what Phase II and III are based upon, is typically bad for gold investors. When money is tight, we don't have inflation, and investors don't need to turn to gold as a hedge against inflation. Without inflation there is no need to hedge.
Another reason we've traditionally seen gold investors benefitting during Phases IV and I of the cycle is that when money is easy, interest rates are low, meaning less opportunity cost for holding the precious metal. To help illustrate, imagine putting your money in a savings account and earning 5 percent on it. Well, the opportunity cost of keeping gold under your mattress would be giving up that 5 percent that you could be earning elsewhere. When your savings account yields next to nothing, some reason, why not just buy some gold?
This pattern is worldwide.
The trends we see in the Fed Funds Rate Cycle are not only U.S. specific. This same idea carries through to the stimulative policies of the European Central Bank and Japan. More countries around the world are applying monetary stimulus programs much like the U.S., while moving away from more restrictive policies. Remember that restrictive policies relate to tightening, which is bad for gold, and stimulative policies relate to easing, which is good for gold.
Right now, gold could use a pick-me-up, and here's why. Over the last several years we've seen slowing money supply growth in many E7 countries. E7 refers to seven countries with emerging economies including China, India, Brazil, Mexico, Russia, Indonesia and Turkey. It's these countries that drive the Love Trade for gold, primarily China and India, who purchase the metal for religious and cultural celebrations.
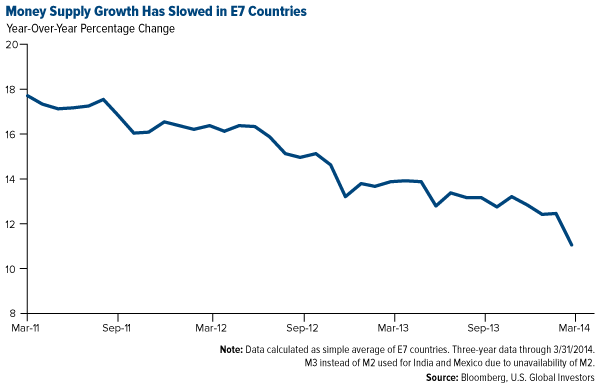
With less money being spent or borrowed, not only did the Love Trade begin to slow, global GDP growth also began to slow as you can see below.
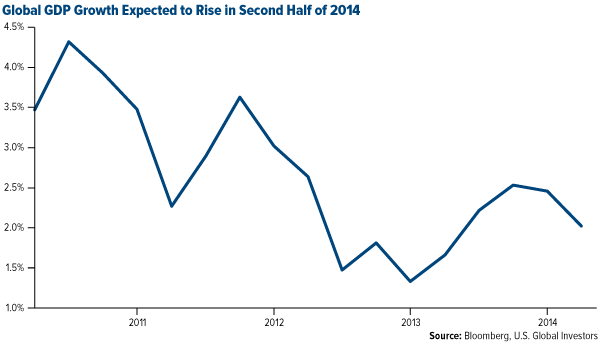
The good news is, as we see various countries applying monetary stimulus, including emerging markets, we can expect this to contribute to global GDP growth. In 2014 global GDP is expected to grow by 3.2 percent, according to the World Bank's latest projections.
Similarly, the money supply of the United States has been a steady grower and the money supply in the E7 countries is also expected to reverse course; right now it is growing again but at a slower rate. The U.S. data suggests that a new easing cycle is starting in Europe, Japan and emerging markets. A pickup in economic activity in the E7, especially the big gold consumers, is yet another positive sign for the yellow metal.
Real interest rates are headed lower for most of the world as well. As money supply grows, countries eventually feel inflationary pressures. This will hold true in the U.S. as we move into 2015 and back into Phase I. All of these changes can lead to a declining confidence in paper money, yet another good sign for gold.
An interesting side note.
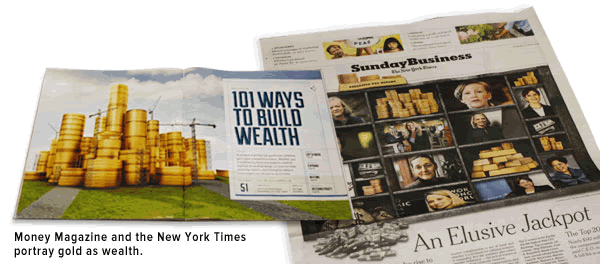
I have noticed that recent articles in both Money Magazine and the New York Times use an array of gold images to illustrate wealth. It seems that while some may debate whether gold is money, gold remains an enduring symbol of wealth.
All opinions expressed and data provided are subject to change without notice. Some of these opinions may not be appropriate to every investor. By clicking the link above, you will be directed to a third-party website. U.S. Global Investors does not endorse all information supplied by this website and is not responsible for its content. This news release may include certain "forward-looking statements" including statements relating to revenues, expenses, and expectations regarding market conditions. These statements involve certain risks and uncertainties. There can be no assurance that such statements will prove accurate and actual results and future events could differ materially from those anticipated in such statements.
M2 Money Supply is a broad measure of money supply that includes M1 in addition to all time-related deposits, savings deposits, and non-institutional money-market funds.M3 money supply is the broadest monetary aggregate, including physical currency, demand accounts, savings and money market accounts, certificates of deposit, deposits of eurodollars and repurchase agreements.
Want to receive more commentaries like this one? Sign up to receive email updates from Frank Holmes and the rest of the U.S. Global Investors team, follow us on Twitter or like us on Facebook.
By Frank Holmes
CEO and Chief Investment Officer
U.S. Global Investors
U.S. Global Investors, Inc. is an investment management firm specializing in gold, natural resources, emerging markets and global infrastructure opportunities around the world. The company, headquartered in San Antonio, Texas, manages 13 no-load mutual funds in the U.S. Global Investors fund family, as well as funds for international clients.
All opinions expressed and data provided are subject to change without notice. Some of these opinions may not be appropriate to every investor.Standard deviation is a measure of the dispersion of a set of data from its mean. The more spread apart the data, the higher the deviation. Standard deviation is also known as historical volatility. All opinions expressed and data provided are subject to change without notice. Some of these opinions may not be appropriate to every investor. The S&P 500 Stock Index is a widely recognized capitalization-weighted index of 500 common stock prices in U.S. companies. The NYSE Arca Gold BUGS (Basket of Unhedged Gold Stocks) Index (HUI) is a modified equal dollar weighted index of companies involved in gold mining. The HUI Index was designed to provide significant exposure to near term movements in gold prices by including companies that do not hedge their gold production beyond 1.5 years. The MSCI Emerging Markets Index is a free float-adjusted market capitalization index that is designed to measure equity market performance in the global emerging markets. The U.S. Trade Weighted Dollar Index provides a general indication of the international value of the U.S. dollar.
Frank Holmes Archive |
© 2005-2022 http://www.MarketOracle.co.uk - The Market Oracle is a FREE Daily Financial Markets Analysis & Forecasting online publication.